Emini weak bull flag in correction to 2350
Updated 6:42 a.m.
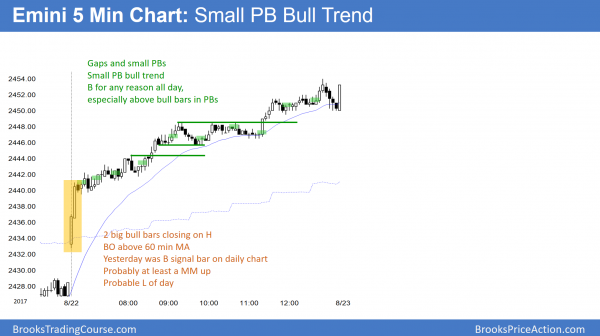
The Emini gapped above yesterday’s high and began with 2 big bull bars closing on their highs. This is a trend from the open bull trend and there is at least a 60% chance that we have seen the low of the day. The bulls hope for a spike and channel bull trend day. However, when there is a gap up and rally on the open, the Emini usually enters a 1 – 2 hour trading range within an hour. The odds then favor trend resumption up.
There is always a bear case. However, without at least a micro double top or a parabolic wedge, the bears would likely have to wait for a trading range. They would then try to create a major trend reversal.
Pre-Open market analysis
The Emini had another trading range day yesterday. Yet, it closed above its midpoint and therefore had a bull body. It is a buy signal bar for a High 2 bull flag today. It is also a wedge bull flag where the July 27 low is the 1st push down. Because the weekly buy climax is so extreme, the odds are that the best the bulls will get is a trading range. It is still more likely that the Emini has begun a 100 – 200 point correction.
Because the past 2 days were trading range days, there is an increased chance of another on today. Additionally, they are bad follow-through for the bears. Hence, they increase the odds of at least a 2 – 3 day bounce. Yet, the odds are that the Emini is in a bear trend so traders will sell rallies on the daily chart.
Test of the weekly EMA
Yesterday’s low got to within 3 points of the weekly moving average. If this week close about 10 points above today’s low, the moving average will get pulled up to above this week’s low. Therefore traders looking at the weekly chart will see this week poking below the average.
This can be true even without the low ever falling below the average. This is because on Friday, the location of the moving average will be based on Friday’s close. Hence, it can end up above the low of the week without the low of the week ever falling to the average.
Bull flag so breakout mode
In addition to the daily chart being in a High 2 bull flag, it is also in a bear channel. Consequently, the bulls will tend to take profits before the rally gets above the August 9 and 16 double top. Furthermore, the bears will sell there. They want another lower high, and then a strong breakout below last week’s low.
In addition to Friday being a buy signal bar for a High 2 bull flag, it is also the bottom of a wedge bull flag. The 1st push down is the July 27 low. This creates the possibility of a bear breakout below a wedge bull flag. The pattern is better for the bears if there is a 2 – 5 day rally up from the bottom. This began with yesterday’s reversal.
If the rally continues for a few more day, but fails to break above the August 16 lower high, the bears will sell. They want to trap the bulls. Their goal would be a break below Friday’s low, which is the bottom of the wedge. If they succeed, their target would be a measured move down based on the height of the wedge. Since the wedge is about 70 points tall, that selloff would reach the 2350 area and test the May 18 low.
Overnight Emini Globex trading
The Emini is up 7 points in the Globex market. It will therefore probably gap above yesterday’s high, triggering a buy signal on the daily chart. However, since the past 2 days were mostly trading range days, today is more likely to be another trading range day than a strong trend day up or down. If there is no strong rally or reversal on the open, the Emini will probably go sideways for an hour or two and enter breakout mode. Furthermore, a trading range open will increase the odds of another mostly trading range day.
Yesterday’s setups
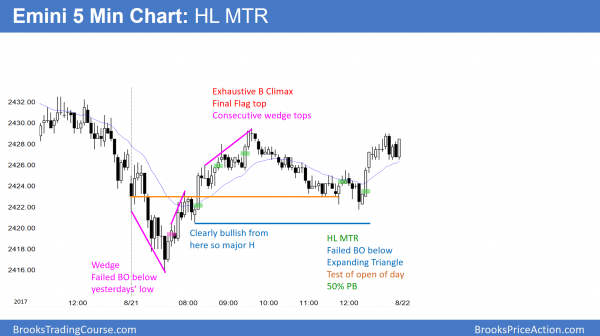
Here are several reasonable stop entry setups from yesterday. I sometimes also show limit order entries and entries on the close of bars.
EURUSD Forex market trading strategies
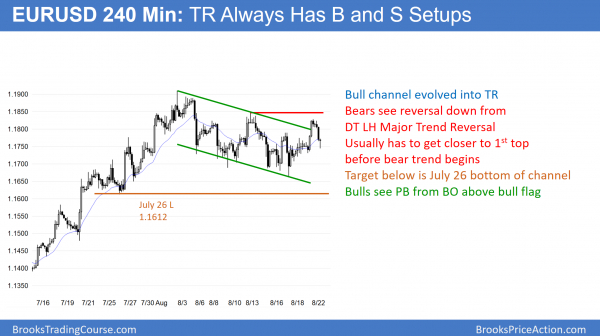
The 240 minute EURUSD Forex chart has been sideways for several weeks. It therefore has both a reasonable sell and buy setup. The breakout will probably reach a 200 pip measured move up or down.
The EURUSD Forex market has been sideways for 3 weeks. It is therefore in breakout mode. While it has a bull flag at the moving average on the daily chart, this pullback is after a buy climax. Furthermore, it is at resistance on the monthly chart. The 240 minute chart is therefore neutral. Hence, there is a 50% chance of a successful breakout up or down. The goal is a 200 pip measured move, based on the height of the range. In addition, there is a 50% chance that the initial breakout will fail and reverse.
The bears see a double top lower high. Since the trading range has lasted far more than 20 bars and it broke below the bull trend line, this pattern is a major trend reversal setup. It therefore has a 40% chance of leading to a swing down. However, the 2nd high of the double top usually gets closer to the 1st high. Therefore, the bears may want one more small leg up that comes within 5 – 10 pips of the August 11 high.
The bulls see the overnight selloff as a pullback from yesterday’s breakout above the 2 week bear channel. A bear channel in a bull trend is a bull flag. If the chart rallies from here, it would create a right shoulder of a head and shoulders bottom bull flag.
While both patterns are good enough, there is no breakout yet. Consequently, the trading range could continue for several more weeks. Since several countries are making interest rate decisions in September, one or more of those decisions might be the catalyst for the breakout.
Overnight EURUSD Forex trading
The 5 minute chart overnight sold off about 80 pips. It therefore reverse yesterday’s rally. Big Up, Big Down patterns are common in trading ranges and usually lead to a continuation of the range. Therefore, despite the strong selloff, the odds are that today will more likely be mostly sideways instead of much more down. Yet, because the daily and 240 minute charts are in breakout mode, a strong trend up or down can come at any time. Unless there is a strong breakout, most day traders will expect to scalp today.
Summary of today’s S&P Emini futures price action and what to expect tomorrow
The Emini gapped up and had 2 strong bull bars. That led to a spike and channel bull trend day. It was also a small pullback bull trend day.
By trading above yesterday’s high, today triggered a High 2 buy signal. Today was a strong bull trend day. Because the buying was climactic, tomorrow will probably have at least a couple hours of sideways to down trading. The bulls need to break above the August 16 lower high. This is because it is a major lower high. The bears need major lower highs. Hence, if the market rallies above, then it is either in a trading range or a bull trend.
See the weekly update for a discussion of the price action on the weekly candlestick chart and for what to expect going into next week.
Traders can see the end of the day bar-by-bar price action report by signing up for free at BrooksPriceAction.com. I talk about the detailed S&P Emini futures price action real-time throughout the day in the BrooksPriceAction.com trading room. We offer a 2 day free trial.
When I mention time, it is USA Pacific Standard Time (the Emini day session opens at 6:30 am PST, and closes at 1:15 pm PST). You can read background information on the intraday market reports on the Intraday Market Update page.


