Trading Update: Friday April 8, 2022
Emini pre-open market analysis
Emini daily chart
- The market went outside yesterday. The bulls are trying for High 2 bull flag on April 6. However, the signal bar is weak.
- The bulls want this current bull flag to lead to an upside breakout of the February high and the March 29 high and a measured move up of the bull flag (March 29 – April 6). This would project up to the all-time high.
- The bears want this H2 bull flag to fail and lead to a bear breakout and measured move down based on the March 29 – April 6) range, which would project down to the April 15 signal bar high. While a bear breakout of the bull flag and measured move down does not appear likely, one must remember that probabilities are much closer to 50% in a trading range than they appear.
- The market will likely continue sideways around this price level as the bulls try for an upside breakout of the bull flag, and the bears try for the failed H2 and measured move down.
- March 3 is a critical breakout point, and it is not far below the April 7 low. Since the market is in a trading range, traders will wonder if the market will have to reach it soon.
- Today is Friday, so the weekly chart is important. Last week’s low was 4501.25 and will likely be a magnet today. The bulls want to close above last week’s low, and the bears want to close below it.
- This week’s bar is also a doji, and so far, the market is around the midpoint, so traders will pay attention to the week’s midpoint. The midpoint is around yesterday’s high (4516).
- Overall, traders should expect more sideways and for the bulls to try for the H2 bull flag, and the bears fight to prevent the H2 from being successful.
Emini 5-minute chart and what to expect today
- Emini is down 6 points in the overnight Globex session.
- The bears had a strong bear breakout early, around 1:00 AM PT, which followed a strong rally during last night’s Globex session. This increases the odds of the market going sideways on the open.
- As always, traders should expect a limit order open, and consider not trading for the first 6-12 bars, unless they are comfortable with being able to make quick decisions.
- Most traders should wait for a credible stop entry such as a double bottom/top or a wedge bottom/top or wait for a decisive breakout with follow-through.
- Since today is Friday, there is an increased risk of the market going sideways on the open and getting a surprise breakout late due to the weekly chart.
Yesterday’s Emini setups – Will be available later
Emini charts created by Brad. Al will be back on April 11, 2022
EURUSD Forex market trading strategies
EURUSD Forex daily chart

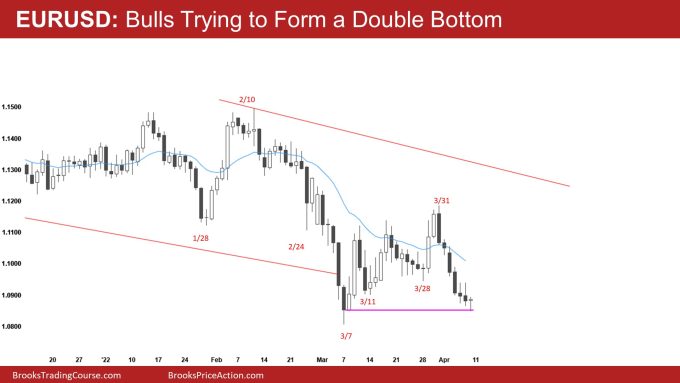
- Today reached the March 7 close. The bulls hope there will be buyers at this price level (bears buying back shorts, bulls buying to get long), and there likely will be.
- The bulls have a problem: there are six consecutive bear bars on the daily chart, so even if the bulls get a strong bull close today, it will probably lead to a minor reversal at best. The bulls will need a micro double bottom before getting a reversal up.
- The bears hope that the six consecutive bear bars will be enough to entice bears to stay short and bet on a breakout below March 7.
- More likely, the market will go sideways here, and the bulls fight for a double bottom, and the bears fight for a breakout below March 7.
- When the market is in a trading range, things are common not to look right. For example, the bears did a great job getting four consecutive bear bars, with three closing on their lows on April 5; however, instead of racing down to the March 7 low, the market hesitated at important support.
- The bulls are trying to bottom at important support. However, they have the problem of too many bear bars, which will make traders hesitate and potentially wait to buy a second entry.
- Overall, traders should expect a bounce on the daily chart for a day or two. The market has six consecutive bear bars, which means the odds favor a bull close today. The bulls will probably only be able to get a minor reversal and need a second entry to buy to get a credible bottom.
- Another thing to note is that the March 30 bull close was a reasonable buy, and it never let those Buy the Close traders out. This means the March 30 close will be a magnet, and the market will likely have to get back to the March 30 close, even if it takes two weeks.
Summary of today’s S&P Emini futures price action and what to expect tomorrow

Emini charts created by Brad. Al will be back on April 11, 2022
End of day summary
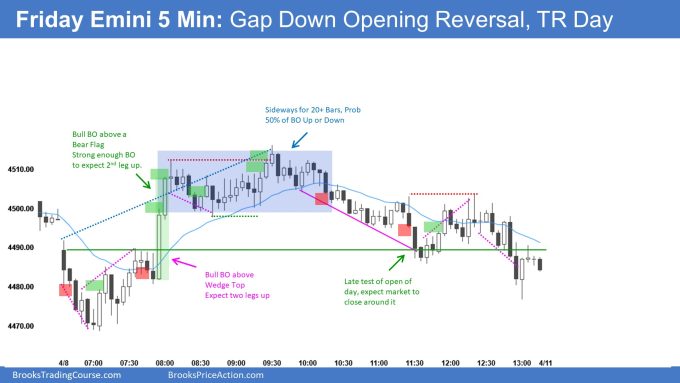
- The market sold off in a 6-bar bear microchannel and reversed following a wedge bottom.
- Although the channel down was tight, 50% of the time, you get a major reversal on the open, so it was reasonable to look for a swing buy. The bears tried to form a wedge bear flag around 7:45, but the bulls got a breakout. When you get a successful bull breakout of a wedge bear flag, the odds favor two legs up.
- The bulls got two consecutive big bull bars around 8:00. These two bull breakout bars were strong enough for at least a second leg up. However, instead of getting a strong second leg up, the market went sideways for 20+ bars and got a failed bull breakout of the final flag, leading to an endless pullback.
- When the market goes sideways for 20+ bars after the breakout, it is best to assume the probability is around 50% up or down.
- Overall, the market was in a trading range, and the bulls got a measured move from the low of the day to the open of the day, projecting up (the market went a little above it. The bulls also got a measured move projection of the bull breakout of the bear flag (low of the day to the high of 7:45) projecting up.
- When there is a measured move from the low of the day to the open, projecting up, it is essential to pay attention to the open of the day because it will usually be around the midpoint of the range, which means the market will likely test it like it did around 11:30 PT.
See the weekly update for a discussion of the price action on the weekly chart and for what to expect going into next week.
Trading Room
Traders can see the end of the day bar-by-bar price action report by signing up for free at BrooksPriceAction.com. I talk about the detailed S&P Emini futures price action real-time throughout the day in the BrooksPriceAction.com on trading room days. We offer a 2 day free trial.
Charts use Pacific Time
When I mention time, it is USA Pacific Time. The Emini day session charts begin at 6:30 am PT and end at 1:15 pm PT which is 15 minutes after the NYSE closes. You can read background information on the market reports on the Market Update page.

