Emini tight trading range before budget and tax cut votes
Updated 6:48 a.m.
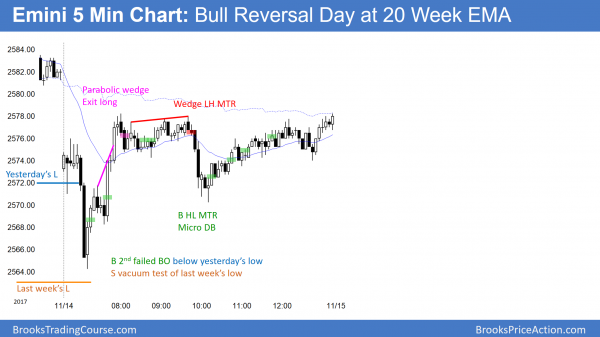
The 1st 2 bars were big bear bars closing on their lows. Furthermore, by breaking below last week’s low, the selloff triggered a sell signal on the weekly chart. The odds favor a bear trend day. However, there could be a deep pullback to a wedge bear flag or a double top bear flag near the moving average.
When a market falls far below the 20 day EMA on the open, if usually enters a trading range for an hour or more. However, unless the bulls get a strong reversal up above the high of the day, the best they probably will get is a trading range. At the moment, the Emini is Always In Short and either a bear trend day or a trading range day is likely. Since the bulls have bought every selloff over the past 6 months, they will buy this one as well. However, the odds favor a bear flag rather than a bull trend.
Pre-Open market analysis
Yesterday was another reversal day up from the 20 day exponential moving average. Yet, the Emini is still in its 3 week tight trading range. Because the bull trend on the daily chart is strong, the odds continue to favor at least slightly higher prices.
The 60 minute chart has a 3 week head and shoulders top. Yet, a top only has a 40% chance of leading to a swing down. In addition, all head and shoulders tops are also triangles. Since the triangle is in a bull trend, the odds slightly favor a bull breakout.
The buy climaxes on the daily, weekly, and monthly charts are the most extreme in history. There is therefore an increased risk of big bear days coming at any time. If the bears get consecutive big bear days, the odds would favor a 5% correction.
Overnight Emini Globex trading
The Emini is down 12 points in the Globex market. It is again testing last week’s low and the 20 day EMA. This will be the 5th day over the past 6 days where there is a big gap down from the prior day’s close. Since this is not common in a bull trend, the odds are increasing that a pullback is beginning.
Each of the past 4 times that the Emini gapped down, it reversed back up from around the 20 day EMA. However, there has been no follow-through buying. This will make the bulls wonder if they are buying too high. If they conclude that they are, they will wait to buy lower. This could result in a couple big bear trend days. That is the minimum that traders need to see to conclude that a 5% correction might be beginning.
While the bull trend is weakening, until the bears get consecutive big bear days, the odds continue to favor reversals after every selloff. Because most of the days in the 3 week tight trading range have had at least one strong swing, the odds favor that again today.
However, after so many reversals over the past week, the odds are increasing that there will be a breakout soon. Either the bulls will get follow-through after a reversal up and the rally will make a new all-time high, or the bears will get a measured move down to below the October 25 bottom of the wedge, and possibly to below the August 8 breakout point.
Yesterday’s setups
Here are several reasonable stop entry setups from yesterday. I sometimes also show limit order entries and entries on the close of bars.
EURUSD Forex market trading strategies
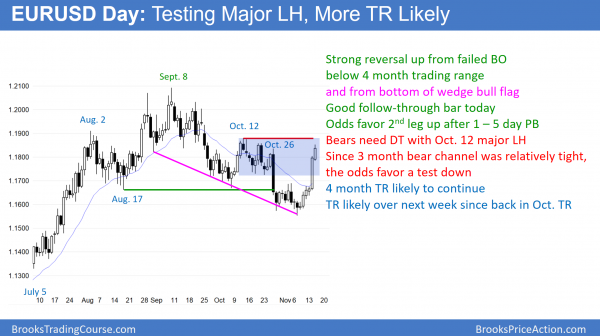
Yesterday was a big bull trend bar that reversed up from below a 4 month trading range. It was also a reversal up from a wedge bull flag. If today ends up with a bull body, that will confirm the reversal. It would therefore make a 2nd leg sideways to up likely. The rally is testing a major lower high. The odds favor a small trading range over the next week
Yesterday was a strong reversal up from a wedge bull flag at the 20 week EMA (chart not shown today). Yet, the 3 month bear channel on the weekly chart was tight. Therefore, the bears will probably get a test down within a couple of weeks.
However, the 2 day rally on the daily chart was strong. Furthermore, it is a breakout above a wedge bottom. Consequently, the bulls will probably get 2 legs sideways to up. The odds are that the 2 day rally will pause around the October 12 high. A trading range will probably form there, like in the 2 weeks after that high.
While it is possible that this rally does not pause and continue up to a new high, the weekly bear channel was tight. Therefore, this 1st reversal up will likely have a pullback within a week. The bears will see the pullback as a reversal down from a double top with the October 12 high. More likely, the bulls will get a higher low and test back up to the high of the current leg up.
These reversals are all within a 4 month trading range. My 80% rule says that 80% of attempts to convert a trading range into a trend fail. Consequently, the odds favor a continuation of the 4 month trading range for possibly a month or more.
Overnight EURUSD Forex trading
The EURUSD 5 minute Forex chart continued its rally overnight. However, it will probably stall around the October 12 major lower high around 1.1880, and then go sideways for at least a few days. Since the rally is now within 25 pips of the target, the odds are that bears will begin to sell for scalps and the bulls will begin to wait to buy pullbacks instead of breakouts. The result will probably be increasing trading range trading today.
Summary of today’s S&P Emini futures price action and what to expect tomorrow
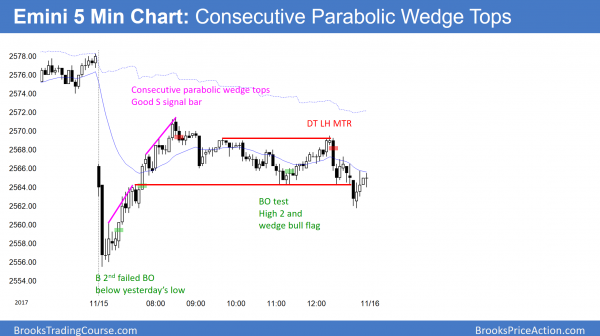
By trading below last week’s low (not shown), the Emini triggered a weekly sell signal. It reversed up from below yesterday’s low with a 2nd entry buy. It reversed down from consecutive parabolic wedge tops and closed below the open.
By breaking below last week’s low, the Emini triggered a weekly sell signal today. In addition, today was the 1st bear bar on the daily chart in 6 days. However, it only had a doji body. In addition, it is still in a month long tight trading range. The bears need consecutive big bear trend bars on the daily chart for traders to assume a 5% correction is underway. Despite the extreme buy climaxes, without a strong bear breakout, the odds continue to favor at least slightly higher prices.
See the weekly update for a discussion of the price action on the weekly candlestick chart and for what to expect going into next week.
Traders can see the end of the day bar-by-bar price action report by signing up for free at BrooksPriceAction.com. I talk about the detailed S&P Emini futures price action real-time throughout the day in the BrooksPriceAction.com trading room. We offer a 2 day free trial.
When I mention time, it is USA Pacific Standard Time (the Emini day session opens at 6:30 am PST, and closes at 1:15 pm PST). You can read background information on the intraday market reports on the Intraday Market Update page.


