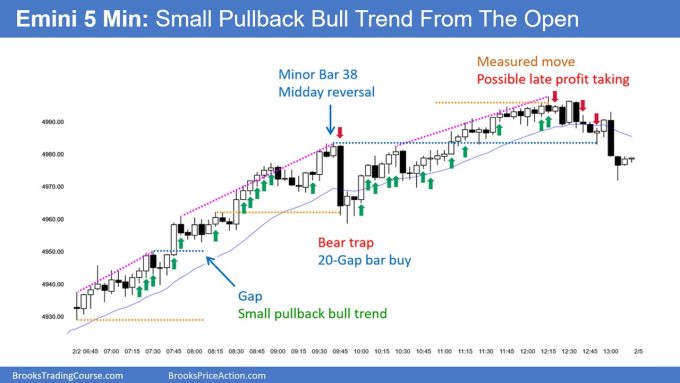
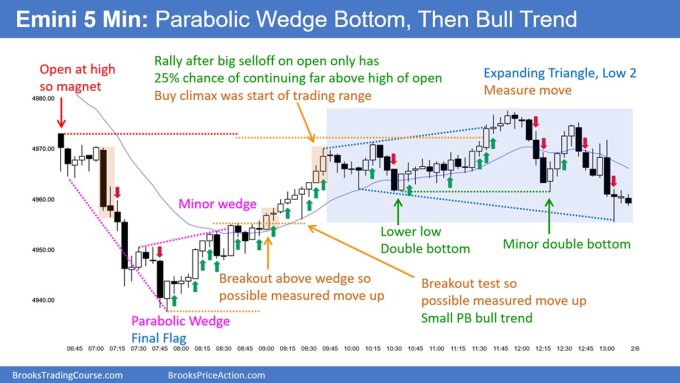
Trading Update: Monday February 5, 2024
S&P Emini pre-open market analysis
Emini daily chart
- Last Friday, the Emini tested the 5,000 Big Round Number, a significant magnet on several higher time frames.
- While the Emini did not reach 5,000 to the tick, it came within 2.25 ticks of the round number. This is a close enough test for traders to see the 5,000 Round Number adequately tested.
- The daily will probably pull back for a bar or two due to traders selling at the 5,000 magnet. Some bulls will sell out of longs, and bears will sell to go short for at least a scalp.
- The market may test down to the January a31st low before re-testing the 5,000 round number.
- Even if the market does get a deep pullback, the odds are high that 5,000 will soon be tested again.
- The last big round number that was similar to 5,000 was 4,000. The market spent a lot of time at the 4,000 round number during 2022, and it had a hard time staying far away from it.
- It is reasonable to assume that the market will go sideways at 5,000 for some.
- Without a strong breakout far below 5,000 the odds are that the market will begin to go sideways around the 5,000 round number for some time. The other reason the market will have to go sideways for so long is due to the lack of selling pressure on the higher time frame (weekly chart).
- Overall, today will probably disappoint the bulls, and traders should be prepared for a possible inside bar closing on its low. Traders will pay close attention to see how determined the bulls are to get above Friday’s high and reach 5,000 since it missed the target by two ticks.
Emini 5-minute chart and what to expect today
- Emini is down 15 points in the overnight Globex session.
- The Globex market has gone sideways for most of the overnight session.
- Traders should assume that the opening of the U.S. Session will have a lot of trading range price action.
- Most traders should wait for 6 – 12 bars before placing a trade, unless they can make quick decisions and ideally trade with limit orders.
- In general, there is a 50% chance that the opening breakout will form a major reversal and go in the opposite direction. There is an 80% chance that the opening breakout will form at least a minor reversal.
- There is an 80% chance of a trading range open and a 20% chance of trend from the open. This means that most days go sideways on the open, meaning there is no rush on the open to trade.
- Most traders should try to catch the opening swing that often begins after the formation of a double top/bottom or a wedge top/bottom. This is because there is an 80% chance of a trading range open.
- The opening swing trade is important because it provides excellent risk/reward with decent probability, allowing traders to enter on a swing entry.
- Most days have an opening swing that lasts at least two hours and two legs and will often double the opening range.
- Lastly, traders should pay close attention to the opening of the day, as well as yesterday’s high, as both will likely be magnets during today’s U.S. session.
Friday’s Emini setups

Al created the SP500 Emini charts.
Here are reasonable stop entry setups from Friday. I show each buy entry bar with a green arrow and each sell entry bar with a red arrow. Buyers of both the Brooks Trading Course and Encyclopedia of Chart Patterns have access to a near 4-year library of more detailed explanations of swing trade setups (see Online Course/BTC Daily Setups). Encyclopedia members get current daily charts added to Encyclopedia.
My goal with these charts is to present an Always In perspective. If a trader was trying to be Always In or nearly Always In a position all day, and he was not currently in the market, these entries would be logical times for him to enter. These therefore are swing entries.
It is important to understand that most swing setups do not lead to swing trades. As soon as traders are disappointed, many exit. Those who exit prefer to get out with a small profit (scalp), but often have to exit with a small loss.
If the risk is too big for your account, you should wait for trades with less risk or trade an alternative market like the Micro Emini.
EURUSD Forex market trading strategies
EURUSD Forex daily chart
- The EURUSD is getting a downside breakout below Friday’s strong bear reversal bar.
- The December low is within reach, and the market may have to reach it before bulls are willing to buy.
- At the moment, the bulls who bought above last Thursday’s high are trapped and in a losing position.
- Today, it has the potential to become a successful bear breakout of a bear channel and lead to two legs down.
- At the moment, the bulls will probably wait and see what kind of breakout the bears can get. Traders will pay close attention to see if the bears can get a strong bear breakout today, closing on its low, or if today will disappoint the bears.
Summary of today’s S&P Emini price action

Al created the SP500 Emini charts.
See the weekly update for a discussion of the price action on the weekly chart and for what to expect going into next week.
Trading Room
Al Brooks and other presenters talk about the detailed Emini price action real-time each day in the BrooksPriceAction.com trading room days. We offer a 2 day free trial.
Charts use Pacific Time
When times are mentioned, it is USA Pacific Time. The Emini day session charts begin at 6:30 am PT and end at 1:15 pm PT which is 15 minutes after the NYSE closes. You can read background information on the market reports on the Market Update page.

