Trading Update: Tuesday January 25, 2022
Emini pre-open market analysis
Emini daily chart
- Emini had a 200-point bull reversal day yesterday after falling below the October 2021 lows. A strong reversal up.
- Bulls are hoping the selloff from January 4 to yesterday’s bull reversal bar is a large 2nd leg trap that will lead to a new all-time high.
- Bears see yesterday’s rally as profit-taking after an oversold market testing obvious support (October 2021 low).
- The market is clearly in a trading range on the daily chart. As yesterday’s bull reversal bar looks, traders will expect the bulls to be disappointed soon, just like the bears were disappointed with yesterday’s bull reversal bar.
- Trading ranges typically have deep pullbacks that test breakout points, such as the December 2021 Lows. Some bulls bought the December lows, confident that they could avoid a loss if they used a wide stop and scaled in lower. The above reason makes me think the market will have to get back to the December low soon.
- Yesterday’s bull reversal bar damages the market’s odds going a lot lower before there is a deep rally testing the December lows. The odds are that the market will get a 2nd leg down from the selloff that started on January 12. If the 2nd leg falls below the January 24 low, the market will probably find buyers below.
- Most bears will probably exit around this price level and see any selloff today as a gift to buy back their shorts at a better price than yesterday’s close. The selloff over the past two weeks has created a strong trendline break. Traders will expect a rally, which could rally much further than the bears want. Trading ranges usually have deep pullbacks following strong moves, so I think most bears will look to take profits rather than stay short. Once the market has a few legs up, bears will look to establish new short positions assuming the rally is not too strong.
- It is important to remember that as strong as this selloff is, it is a bull flag on the weekly and monthly charts. The October low is likely to be a minor reversal on the weekly chart, and bulls see it as a great opportunity to buy, which they did yesterday.
Emini 5-minute chart and what to expect today
- Emini is down 67 points in the overnight Globex session.
- While that is many points down, it is not even a 50% pullback of yesterday’s bull reversal bar.
- The odds are that the bears will use this overnight selloff as a way to buy back their shorts at a better price.
- The pre-market selloff looks like a bear leg in a trading range, which makes me think the open may rally.
- While I expect a bull rally on the open, I also expect the bulls to be disappointed today after a strong bull reversal bar yesterday. Trading ranges are notorious for causing disappointment which makes traders question the setup in front of them, such as buying above yesterday’s bull reversal bar. If today is a weak entry bar for the bulls or a bear inside bar, it will make traders question the probability of buying above yesterday.
- As with most days, traders will expect a trading range open and look for a swing trade with a breakout or a second entry buy or sell setup.
Yesterday’s Emini setups

Al created the SP500 Emini charts.
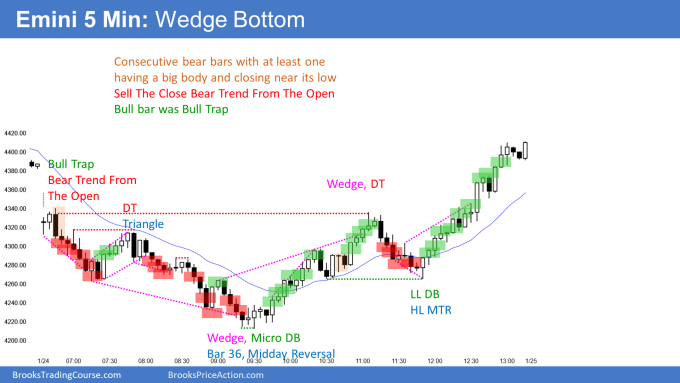
Here are several reasonable stop entry setups from yesterday. I show each buy entry with a green rectangle and each sell entry with a red rectangle. Buyers of both the Brooks Trading Course and Encyclopedia of Chart Patterns have access to a much more detailed explanation of the swing trades for each day (see Online Course/BTC Daily Setups).
My goal with these charts is to present an Always In perspective. If a trader was trying to be Always In or nearly Always In a position all day, and he was not currently in the market, these entries would be logical times for him to enter. These therefore are swing entries.
It is important to understand that most swing setups do not lead to swing trades. As soon as traders are disappointed, many exit. Those who exit prefer to get out with a small profit (scalp), but often have to exit with a small loss.
If the risk is too big for your account, you should wait for trades with less risk or trade an alternative market like the Micro Emini.
EURUSD Forex market trading strategies
EURUSD Forex daily chart

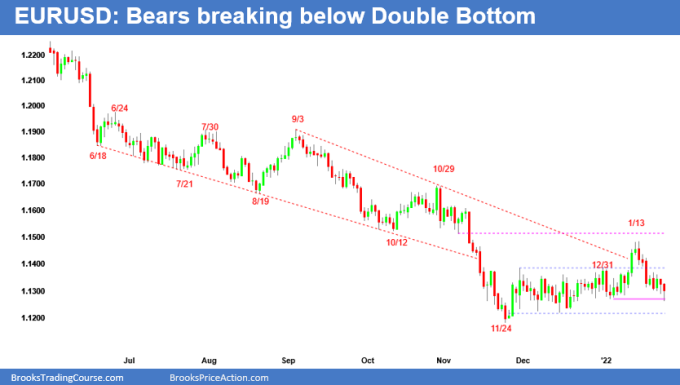
- The EURUSD is currently trying to break below the January lows.
- The bears are hopeful they can get a strong bear close today, demonstrating more follow-through after the 3-day bear breakout ending on January 18. They are hopeful this selloff will break below the November 2021 lows.
- Even if the bears get below the November lows, traders will likely see the bear breakout as a final flag reversal setup and look for reasons to buy.
- The selloff from January 14 is likely in a tight enough channel that the first reversal up will probably fail, and the market will have to go sideways, forming at least some kind of a double bottom.
- So far, today is a big bear bar. However, when you look to the left, it is a trading range, which makes the odds higher that something will be disappointing for the bears either today or tomorrow.
- The bears need to get a decent close today and follow through to convince traders that the selloff may reach the November 2021 low.
Summary of today’s S&P Emini futures price action and what to expect tomorrow

End of day summary
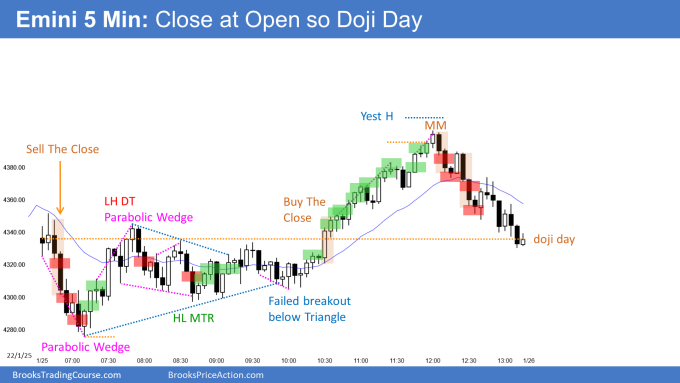
- Today gapped down and formed a parabolic wedge bottom 7:10.
- The first 9 bars of the day were in a tight bear channel, so the odds were the first reversal up would be minor and likely go sideways.
- The market ended up forming a parabolic wedge lower high at 7:50. Traders had to be open to the possibility of a trading range for most of the day.
- The market formed a triangle, and the bears tried several times to break below and failed, so traders had to be open to the possibility of an upside breakout testing the 60-minute moving average and Yesterday’s high (buy a signal bar on the daily chart).
- By 10:35, the bulls achieved a bull breakout with follow-through, and it was a buy the close bull rally.
- Traders had to be open to the idea of a bull breakout above the bar 1 high and a possible measured move up from the low of the day to the open of the day, which was achieved at 12:00. At this point, the open was around the middle of the day’s range, so traders had to be aware of a possible selloff testing the open of the day.
See the weekly update for a discussion of the price action on the weekly chart and for what to expect going into next week.
Trading Room
Traders can see the end of the day bar-by-bar price action report by signing up for free at BrooksPriceAction.com. I talk about the detailed S&P Emini futures price action real-time throughout the day in the BrooksPriceAction.com on trading room days. We offer a 2 day free trial.
Charts use Pacific Time
When I mention time, it is USA Pacific Time. The Emini day session charts begin at 6:30 am PT and end at 1:15 pm PT which is 15 minutes after the NYSE closes. You can read background information on the market reports on the Market Update page.

