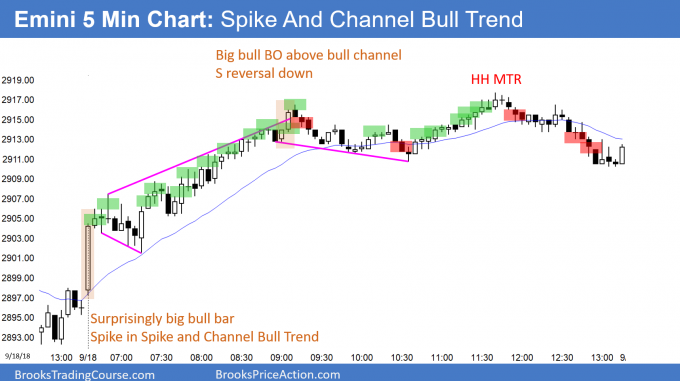
Emini spike and wedge channel bull trend at last week’s high
I will update again at the end of the day.
Pre-Open market analysis
Last week was a bull bar closing on its high on the weekly chart. Since that chart is in a bull trend, last week is a buy signal bar for this week. The Emini rallied to above last week’s high yesterday and triggered the weekly buy signal. However, the weekly chart has also been sideways for 4 weeks. That reduces the chances of strong follow-through buying this week.
Friday was a big bear day. Since it is in a bull leg on the daily chart, it was a buy signal bar for yesterday. The buy triggered yesterday. However, a bear buy signal bar usually has more sellers than buyers above. Many bulls prefer to wait to buy above a bull bar that closes near its high. Since yesterday was a bull bar, many traders will view yesterday as the buy signal bar. But, with its tail on top and 4 sideways days, it is a low probability buy setup.
The 2 week rally has lacked consecutive strong bull bars. It therefore looks more like a bull leg in a trading range than a bull trend. Therefore, many bulls will only buy pullbacks and not a breakout at the high.
Conflicting signs create confusion, which usually results in sideways trading.
Overnight Emini Globex trading
The Emini is down 4 points in the Globex session. It will therefore likely open in the middle of its 4 day tight trading range. The Emini is deciding between a successful breakout above the January high and a failed breakout. While the odds favor a breakout within 2 months, the 2 week rally looks like a bull leg in a trading range. Therefore, the bears will continue to look to sell tops on the 5 minute chart.
While the past 2 days were trend days in opposite directions, they were just legs in the 4 day tight range and the 4 week range. Together, they formed a 2 day trading range. The odds are that trading range price action will continue. Day traders expect at least one reversal every day.
Everyone knows that there will be a strong move up or down soon on the daily chart. When it comes, they will swing trade all day. However, any one day is more likely to have at least one reversal and be mostly sideways.
Yesterday’s setups
Here are several reasonable stop entry setups from yesterday. I sometimes also show limit order entries and entries on the close of bars. My goal with these charts is to present an Always In perspective. If a trader was trying to be Always In or nearly Always In a position all day, and he was not in a position at the moment, these entries would be logical times for him to enter.
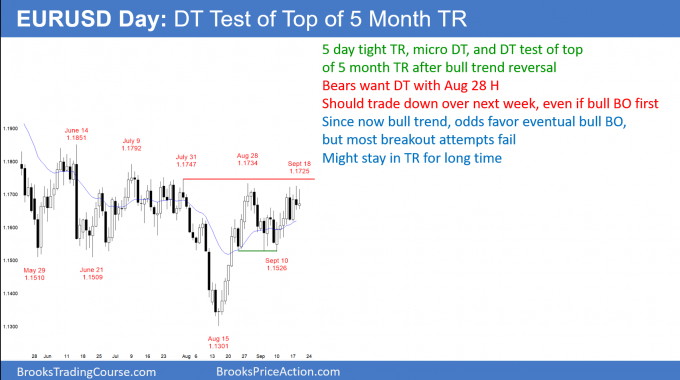
EURUSD Forex micro double top and double top at top of 5 month trading range
The EURUSD daily Forex chart has been in a tight trading range for 5 days. It has a micro double top, a double top, and a lower high, but a strong August bull trend reversal.
The EURUSD daily Forex chart is at the to of its 5 month range. The bulls want at least a small breakout above the July 31 high because that would end the series of lower highs. Traders would then conclude that the bear trend has ended.
The August reversal up was strong enough, given the context, to make the chart likely in an early bull trend. However, until the series of lower highs ends, the chart is also still in a bear trend.
Because most trading range breakout attempts fail, even if the bulls get a breakout above the July high of 1.1747, there will probably be a 1 – 3 week leg down. Trading ranges tend to last much longer than what seems likely. Until there is a clear strong breakout, there is no breakout. Traders will continue to bet on reversals.
For example, the daily chart has been in a tight range for 5 days. Every time it got near the prior day’s high or low, it reversed. I have been writing for the past week that traders should look for reversals around the prior day’s high and low. That is true again today.
Overnight EURUSD Forex trading
The EURUSD 5 minute Forex chart reversed down 60 pips overnight from the top of the 5 day tight trading range. However, it is back to the middle of the range. Furthermore, that range has become a triangle and the 5 minute chart is now at the apex. Therefore, the 5 minute chart will probably be sideways today. Day traders will be scalping. There is no sign of an impending breakout.
Summary of today’s S&P Emini futures price action and what to expect tomorrow
Here are several reasonable stop entry setups for today. I sometimes also show limit order entries and entries on the close of bars. My goal with these charts is to present an Always In perspective. If a trader was trying to be Always In or nearly Always In a position all day, and he was not in a position at the moment, these entries would be logical times for him to enter.
The Emini continued yesterday’s trading range. It might be waiting for next Wednesday’s FOMC announcement before either breaking to the upside or reversing down. Since the 2 week rally has been weak, the odds favor a test of the bull trend line within a week. It is currently around 2895.
See the weekly update for a discussion of the price action on the weekly candlestick chart and for what to expect going into next week.
Trading Room
Traders can see the end of the day bar-by-bar price action report by signing up for free at BrooksPriceAction.com. I talk about the detailed S&P Emini futures price action real-time throughout the day in the BrooksPriceAction.com trading room. We offer a 2 day free trial.
Charts use Pacific Standard Time
When I mention time, it is USA Pacific Standard Time (the Emini day session opens at 6:30 am PST, and closes at 1:15 pm PST). You can read background information on the intraday market reports on the Intraday Market Update page.


