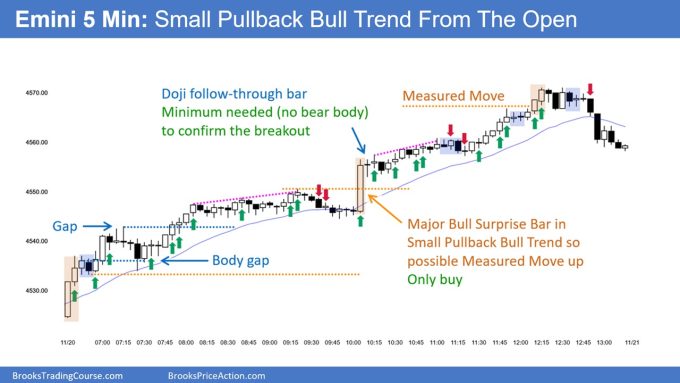
Trading Update: Tuesday November 21, 2023
S&P Emini pre-open market analysis
Emini daily chart
- The Emini rallied yesterday, testing the November 14th high. The market is climactic and far from the moving average. This increases the odds of sideways trading.
- As strong as yesterday’s bar was, it is a buy climax in an extended market. This will increase the odds of a trading range developing soon.
- The bulls are hopeful that today will lead to follow-through buying and that the market will test the September 1st high, which is the top of the bear channel.
- Because of the consecutive buy climaxes during the November rally, the odds favor a pullback and a test of the moving average.
- The market can reach the moving average by selling off to it, or by going sideways which will drag the moving average up to the current price.
- Overall, because of yesterday being climactic, the odds favor today being a trading range bar, or a bear bar, disappointing the bulls. There are probably sellers above yesterday’s high.
Emini 5-minute chart and what to expect today
- Emini is down 13 points in the overnight Globex session.
- The Emini went sideways to down in a bear channel overnight.
- The odds are today will have a lot of trading range price action.
- Because of how climactic yesterday was, the odds favor a trading range open lasting at least 2 hours. There is a 50% chance of follow-through selling on the open. However, there is a 75% chance of a trading range lasting two hours beginning before the end of the second hour.
- As always, traders should consider waiting for 6-12 bars before placing a trade, unless they are comfortable making quick decisions.
- Most traders should try and catch the opening swing that often begins before the end of the second hour. It is common for the opening swing to start after the formation of a double top/bottom, or a wedge top/bottom.
- With the gap down being large, the odds favor an attempt at the gap closing. This means that bar 1 will probably not be the high of the day.
Emini intraday market update
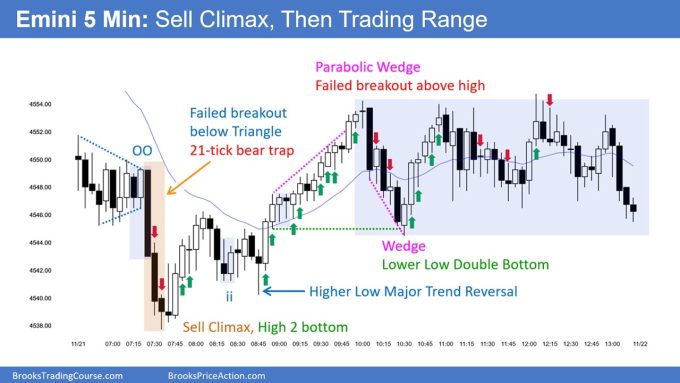
- The Emini went sideways for the first 10 bars for the first 10 bars of the day, following a Gap down.
- The gap was strong enough to increase the odds of a second leg down, which is why bars 11 – 12 happened.
- As strong as bar 11 – 12 was, the bears were quickly disappointed, and the market went sideways.
- The bulls ended up getting a higher low major trend reversal on bar 27 that led to a rally and new high of the day.
- The bulls are trying to get a bull trend bar on the daily chart. As of bar 40, they have done a good job with the rally. However, it will probably begin got go sideways soon.
- As of bar 41, it is too early to be looking for sell. The market is in a small pullback bull rally, and therefore traders should not short.
- Today will probably be a trading range day after the selloff down to bar 47. Traders will pay close attention to the open of the day.
Yesterday’s Emini setups

Al created the SP500 Emini charts.
Here are reasonable stop entry setups from yesterday. I show each buy entry bar with a green arrow and each sell entry bar with a red arrow. Buyers of both the Brooks Trading Course and Encyclopedia of Chart Patterns have access to a near 4-year library of more detailed explanations of swing trade setups (see Online Course/BTC Daily Setups). Encyclopedia members get current daily charts added to Encyclopedia.
My goal with these charts is to present an Always In perspective. If a trader was trying to be Always In or nearly Always In a position all day, and he was not currently in the market, these entries would be logical times for him to enter. These therefore are swing entries.
It is important to understand that most swing setups do not lead to swing trades. As soon as traders are disappointed, many exit. Those who exit prefer to get out with a small profit (scalp), but often have to exit with a small loss.
If the risk is too big for your account, you should wait for trades with less risk or trade an alternative market like the Micro Emini.
EURUSD Forex market trading strategies
EURUSD Forex daily chart
- The bulls formed a strong upside breakout on November 14th and got a second leg up, testing the August 30th major lower high.
- The odds are that the market will begin to correct and form a large trading range on the daily chart, after the bear channel that started in July 2022.
- The next target for the bulls is the August 10th high.
- The market is getting far from the moving average, increasing the odds of sideways trading until the market can get closer to the moving average.
Summary of today’s S&P Emini price action

Al created the SP500 Emini charts.
End of day video review
End Of Day Review will be presented in the Trading Room today. See below for details on how to sign up.
See the weekly update for a discussion of the price action on the weekly chart and for what to expect going into next week.
Trading Room
Al Brooks and other presenters talk about the detailed Emini price action real-time each day in the BrooksPriceAction.com trading room days. We offer a 2 day free trial.
Charts use Pacific Time
When times are mentioned, it is USA Pacific Time. The Emini day session charts begin at 6:30 am PT and end at 1:15 pm PT which is 15 minutes after the NYSE closes. You can read background information on the market reports on the Market Update page.

