Emini and Forex Trading Update:
Tuesday January 28, 2020
I will update again at the end of the day.
Pre-Open market analysis
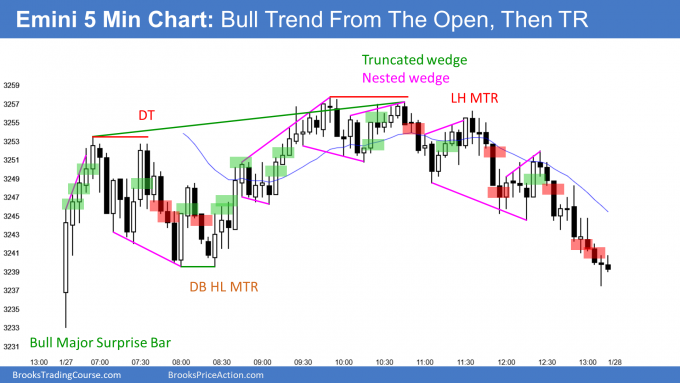
Yesterday opened with a huge gap down. Because that made the Emini oversold, many bears took profits and aggressive bulls bought. After a rally on the open, the Emini went sideways for the rest of the day. Yesterday is a weak buy signal bar for today.
Most traders expect more of a pullback from the all-time high. The minimum target is the January 6 low of 3213.25. That is the start of the final leg up on the daily chart. Traders see that as the first target once profit-taking begins.
The 3200 Big Round Number is just below that. A 5% pullback is a psychological support area and it is 3171. Many bulls like to buy 5 or 10% pullbacks. That is another reason to expect lower prices.
Profit-taking (a short covering rally) in a bear breakout typically lasts a couple days. Consequently, there might be follow-through buying today. However, the selloff was surprisingly strong. Traders expect at least a small 2nd leg down. The magnets below make a 2nd leg down likely.
Traders see 3300 as an important price. It was resistance until January 15 and support until January 23. Consequently, it might get tested before the 2nd leg down begins.
Importance of the January open
There is one final important point. I wrote last week that this is the last week of the month. I said that the Emini might oscillate around the open of the month all week. Then, on Friday, decide whether January will have a bull or bear body on the monthly chart.
Yesterday spent a lot of time around the January open. It will be a magnet all week. If the bears get a close below the open of the month, January will be a strong sell signal bar. However, after 4 strong months up, any selloff will probably only last a bar or two (a month or two).
Overnight Emini Globex trading
The Emini is up 20 points in the Globex session. Yesterday was a trading range day and today will open around yesterday’s high. The bears want a double top with yesterday’s high, a break below yesterday’s low, and then a measured move down and a break below 3200.
More likely, the bulls will get a sideways to up move for at least one more day. There might be a rally back up to 3300 this week before there is a 2nd leg down to below 3200.
Tomorrow’s FOMC announcement could be a catalyst for a sharp move up or down. However, unless there is a strong rally to above the all-time high, traders suspect that this selloff will not end until it has reached at least 5%.
Yesterday’s setups

Here are several reasonable stop entry setups from yesterday. I show each buy entry with a green rectangle and each sell entry with a red rectangle. I rarely also show limit order entries and entries on the close of bars. Buyers of the Brooks Trading Course and Encyclopedia of Chart Patterns have access to a much more detailed explanation of the swing trades for each day.
My goal with these charts is to present an Always In perspective. If a trader was trying to be Always In or nearly Always In a position all day, and he was not currently in the market, these entries would be logical times for him to enter.
EURUSD Forex market trading strategies

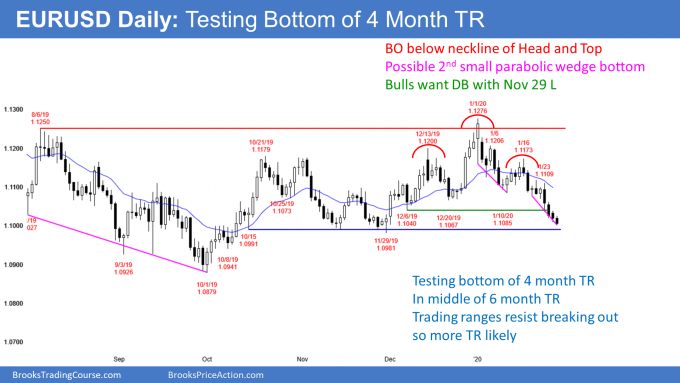
The daily chart of the EURUSD Forex market has been selling off for 4 weeks. It broke below the neckline of a head and shoulders top and it is now testing the bottom of a 4 month trading range.
That range is within a 6 month range. Both are within a 2 year bear channel. Ever leg up and down for 2 years has reversed within a few weeks. Traders are confident that this one will reverse up for 200 or more pips at some point.
But they do not know from what level. Will it be from around 1.10 and the October/November double bottom, or from below the October low at the bottom of the 2 year bear trend? Or, less likely, with the EURUSD collapse to far below the October low?
While a reversal up for 2 – 3 weeks is likely to begin at any time, until there is a bottom, there is no bottom. Furthermore, January traded above the December high. It traded below the December low today by 1 pip. January is therefore an outside down candlestick on the monthly chart in a bear trend.
That is often a significant sign of strong bears. But the monthly chart has been in a tight trading range for 6 months. An outside bar is less important in this context. It slightly increases the chance of the bear trend continuing down to the measured move targets and the gap on the daily chart, all around 1.08.
The trading range is more important. Traders continue to expect a 2 – 3 week rally to begin within a couple weeks.
Overnight EURUSD Forex trading
The 5 minute chart of the EURUSD Forex market traded below the December low by 1 pip overnight. When a Forex market breaks below a major support level by 1 pip and then bounces, it is telling traders that the support might hold.
This increases the chance of a bounce up in February. The bulls did not give up and the bears did not sell aggressively. Instead, the bears bought back shorts and the bulls bought for a bounce. This is trading range behavior.
Additionally, the overnight range has been small. That increases the chance that the weak selloff will transition into a trading range day today.
Because the EURUSD is at major support, there is an increased chance of a big trend day up or down. But, there is no sign of one yet. Traders might be waiting for tomorrow’s FOMC announcement before deciding whether to begin a sharp move up or down from here.
Summary of today’s S&P Emini futures price action and what to expect tomorrow

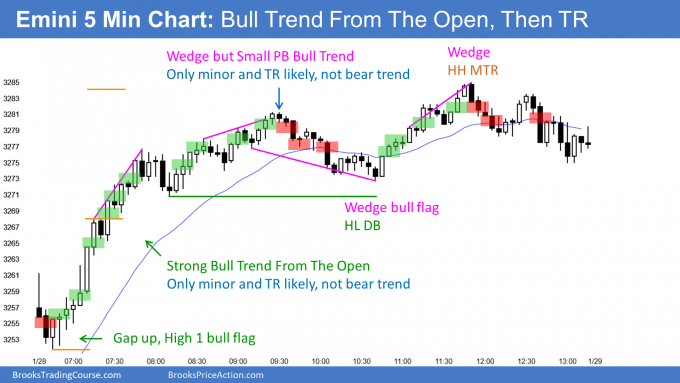
Here are several reasonable stop entry setups for today. I show each buy entry with a green rectangle and each sell entry with a red rectangle. I rarely also show limit order entries and entries on the close of bars. Buyers of the Brooks Trading Course and Encyclopedia of Chart Patterns have access to a much more detailed explanation of the swing trades for each day.
My goal with these charts is to present an Always In perspective. If a trader was trying to be Always In or nearly Always In a position all day, and he was not currently in the market, these entries would be logical times for him to enter.
End of day summary
The Emini had a climactic rally on the open. That usually leads to a trading range for most of the rest of the day, and it did today.
The bulls closed the gap below Friday’s low. However, the odds still favor a 2nd leg down to below 3200 within a couple weeks. This is true even of the rally continues up to the all-time high.
There is an FOMC report tomorrow at 11 am PST. However, traders are not expecting any surprise. After the 2 day rally exhausts itself, the odds still favor sideways to down to below 3200 for at least a brief 2nd leg.
See the weekly update for a discussion of the price action on the weekly chart and for what to expect going into next week.
Trading Room
Traders can see the end of the day bar-by-bar price action report by signing up for free at BrooksPriceAction.com. I talk about the detailed S&P Emini futures price action real-time throughout the day in the BrooksPriceAction.com trading room. We offer a 2 day free trial.
Charts use Pacific Standard Time
When I mention time, it is USA Pacific Standard Time (the Emini day session opens at 6:30 am PST, and closes at 1:15 pm PST). You can read background information on the intraday market reports on the Market Update page.

