Trading Update: Friday May 6, 2022
Emini pre-open market analysis
Emini daily chart
- The bears completely reversed bull breakout bar (May 4 bull trend bar). However, the bears were unable to close the market on its low.
- Yesterday also has a big tail below it, increasing the odds of a possible inside day today.
- Bulls wants a bull close today and view yesterday’s big bear bar as a breakout pullback of the May 4 bull trend bar. They are still hopeful that the market breaks above the double bottom April 28 and May 4 neckline, and the market rallies for a measured move up.
- The bulls want the market to reach the April 18 breakout point of the wedge and the April 21 top of the bear breakout bar.
- The bears hope that yesterday is strong enough to trap bulls and break below the May 2 low.
- As I said a few days ago, one of the problems the bulls have is the monthly chart moving average. The market finally reached the 20-bar moving average on the monthly chart. However, it only went around 50 points below the moving average.
- Look back since 2008, and you will notice that almost every time the market touched the moving average, it went at least 100 points below it. This makes me think that May 2 is not the final low and that the market may break below it and sell off to at least 4,000 and probably lower.
- Of course, a selloff is not guaranteed, and the bulls may get a strong rally over the next couple of weeks, and if the rally is big enough, it could drag the moving average price up on the monthly chart. This would indicate that the price went 100 points below the 20 period moving average when it did not.
- Overall, traders should expect sideways over the next couple of days and more trading range price action.
Emini 5-minute chart and what to expect today
- ***I have to travel early in the morning via plane and will post pre-market update as long as I am connected to the internet. ***
- Emini is down 30+ points in the overnight Globex session.
- …
Yesterday’s Emini setups

Al created the SP500 Emini charts.
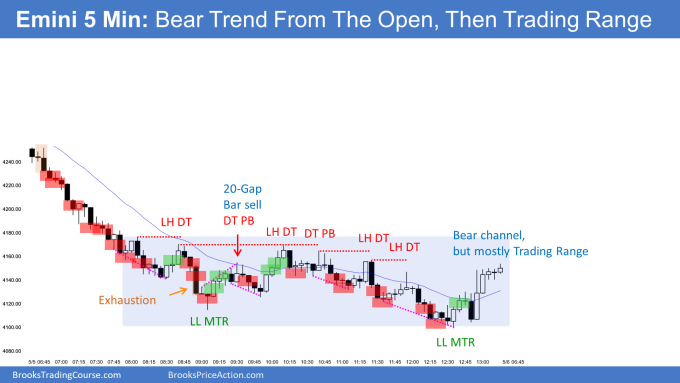
Here are several reasonable stop entry setups from yesterday. I show each buy entry with a green rectangle and each sell entry with a red rectangle. Buyers of both the Brooks Trading Course and Encyclopedia of Chart Patterns have access to a much more detailed explanation of the swing trades for each day (see Online Course/BTC Daily Setups).
My goal with these charts is to present an Always In perspective. If a trader was trying to be Always In or nearly Always In a position all day, and he was not currently in the market, these entries would be logical times for him to enter. These therefore are swing entries.
It is important to understand that most swing setups do not lead to swing trades. As soon as traders are disappointed, many exit. Those who exit prefer to get out with a small profit (scalp), but often have to exit with a small loss.
If the risk is too big for your account, you should wait for trades with less risk or trade an alternative market like the Micro Emini.
EURUSD Forex market trading strategies
EURUSD Forex daily chart

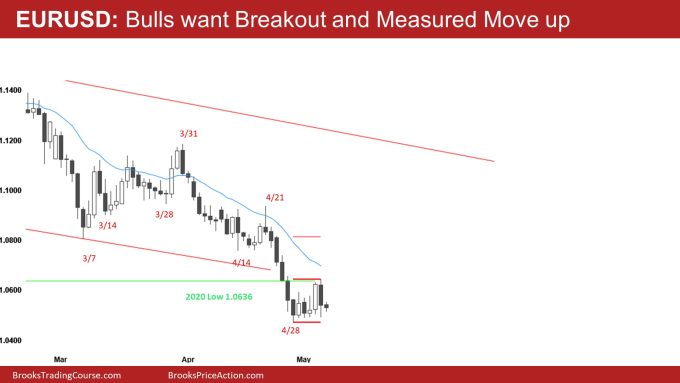
- The bears completely reversed the May 4 rally that reached the 2020 low.
- While the bears did an excellent job reversing the market, the past 6 bars are still in a tight trading range, which increases the odds of more sideways trading.
- Bulls hope yesterday’s bear trend bar is just a breakout pullback of the May 4 rally and that the market will still get the upside breakout of the neckline of the double bottom.
- One can also say that an upside breakout of yesterday’s high would be a bull breakout of a bear flag and lead to a possible measured move which would project up to 1.0817. This would create a possible final flag reversal on the daily chart.
- The bears hope that the 6-bar selloff that started on April 21 will lead to a couple of legs down and reach the 2017 low of 1.0339.
- Overall, the odds favor the market reaching the March – April trading range and the April 25 high. April 25 is a likely exhaustive breakout.
- Traders should expect continued trading range price action and a possible rally over the next few trading days.
Summary of today’s S&P Emini futures price action and what to expect tomorrow

Al created the SP500 Emini charts.
End of day summary
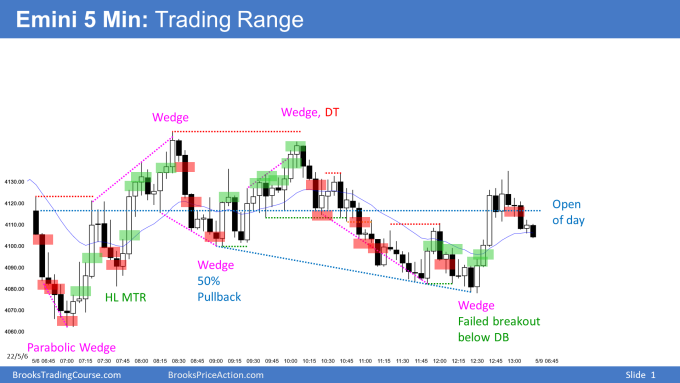
- Today was a trading range day that had lots of reversals up and down.
- The bears had six bear bars on the open. However, the bulls completed reversed the move back to the open of the day.
- When has a big move down and a big move up, this makes traders confused and increases the odds of a trading range day.
- Overall, on a day like today, it is important not to sell too low or buy too high.
- Trading ranges are always tempting traders to bet on breakouts which is a bad strategy on a day like today, and traders should instead look for failed breakouts.
- Lastly, when the day is a trading range day, traders will pay close attention to the open and fade breakouts betting that the market will test back to the open of the day.
See the weekly update for a discussion of the price action on the weekly chart and for what to expect going into next week.
Trading Room
Traders can see the end of the day bar-by-bar price action report by signing up for free at BrooksPriceAction.com. Al talks about the detailed S&P Emini futures price action real-time throughout the day in the BrooksPriceAction.com on trading room days. We offer a 2 day free trial.
Charts use Pacific Time
When times are mentioned, it is USA Pacific Time. The Emini day session charts begin at 6:30 am PT and end at 1:15 pm PT which is 15 minutes after the NYSE closes. You can read background information on the market reports on the Market Update page.

