Trading Update: Thursday December 28, 2023
S&P Emini pre-open market analysis
Emini daily chart
- The Emini rallied yesterday, closing above Tuesday’s high. As strong as the bulls have been, the odds favor profit-taking above the December 20th high.
- The Bulls have done a good job reversing the December 20th outside down bar, but the odds still favor a second leg down.
- Today will probably disappoint the bulls. This means that today, it has the potential to be a small doji or a bear reversal bar.
- The market has been away from the moving average for more than 37 bars. While this is a sign of strong buying, it is also climactic behavior.
- The market is within 30 points of the March 2022 high, and it may have to reach it before selling off to the moving average.
- Overall, the odds favor the bull trend that began in October 2023, converting into a trading range and testing the moving average.
Emini 5-minute chart and what to expect today
- Emini is down 3 points in the overnight Globex session.
- The overnight Globex market went sideways for several hours above yesterday’s high. However, the bulls failed to stabilize the market, and the bears were able to overwhelm the bulls and drive the market down back into yesterday’s range.
- Today has the potential to be a bear trend day due to the daily chart being overbought.
- Traders should pay attention to the day’s open, yesterday’s high, and the December 20th high, as they will all probably be magnets.
- Most traders should consider waiting for at least 6 – 12 bars before placing a trade unless they are comfortable making quick decisions since most breakouts fail.
- There is only a 20% chance of a trend from the open and an 80% chance of a trading range open. This means there is no rush to trade the first few bars of the day.
- Most traders should try to catch the opening swing that often begins before the end of the second hour after the formation of a double top/bottom or a wedge top/bottom.
Yesterday’s Emini setups

Al created the SP500 Emini charts.
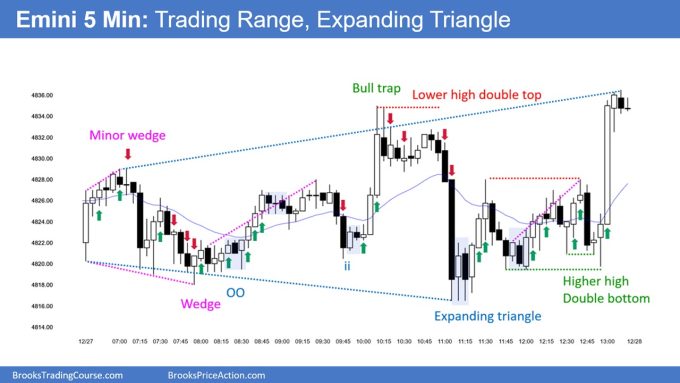
Here are reasonable stop entry setups from yesterday. I show each buy entry bar with a green arrow and each sell entry bar with a red arrow. Buyers of both the Brooks Trading Course and Encyclopedia of Chart Patterns have access to a near 4-year library of more detailed explanations of swing trade setups (see Online Course/BTC Daily Setups). Encyclopedia members get current daily charts added to Encyclopedia.
My goal with these charts is to present an Always In perspective. If a trader was trying to be Always In or nearly Always In a position all day, and he was not currently in the market, these entries would be logical times for him to enter. These therefore are swing entries.
It is important to understand that most swing setups do not lead to swing trades. As soon as traders are disappointed, many exit. Those who exit prefer to get out with a small profit (scalp), but often have to exit with a small loss.
If the risk is too big for your account, you should wait for trades with less risk or trade an alternative market like the Micro Emini.
EURUSD Forex market trading strategies
EURUSD Forex daily chart

- The EURUSD is beginning to pull back following yesterday’s strong entry bar after Tuesday’s High 1 buy signal bar.
- It was reasonable to sell above Tuesday’s high 1 buy signal bar, which means the market will probably retest Tuesday’s high today or tomorrow.
- There are trapped bears who sold above Tuesday’s high 1 and scaled in higher. Those bears are likely disappointed and will look to buy back shorts at that high 1.
- The bulls are hopeful that any reversal down will be minor and lead to higher prices.
- Because the daily chart is in a large trading range, the pullback could be much deeper than what the bulls expect. It is reasonable for bulls to exit below today’s bar if it forms a bear reversal bar closing on its low.
- It was reasonable for bears to sell above the November 29th high. This means the market will probably test this high and allow the scale in bears out with a profit on their higher entry.
Summary of today’s S&P Emini price action

Al created the SP500 Emini charts.
See the weekly update for a discussion of the price action on the weekly chart and for what to expect going into next week.
Trading Room
Al Brooks and other presenters talk about the detailed Emini price action real-time each day in the BrooksPriceAction.com trading room days. We offer a 2 day free trial.
Charts use Pacific Time
When times are mentioned, it is USA Pacific Time. The Emini day session charts begin at 6:30 am PT and end at 1:15 pm PT which is 15 minutes after the NYSE closes. You can read background information on the market reports on the Market Update page.

