Emini outside down week in buy climax before tax reform
Updated 6:54 a.m.
Today gapped above the 60 minute moving average and the daily measured move target. It is close to yesterday’s high, which is a magnet. However, after a bull reversal day, a trading range is more likely than a strong bull trend. Consequently, the bulls will need a strong rally to convince traders that today will be a strong bull trend day.
Because yesterday’s rally, especially into the close, was strong, the bears will probably need a 1 – 2 hour trading range before they can get a major reversal. Consequently, the odds are that the 1st selloff will be minor. This is true even if it retraces more than 50% of the rally of yesterday’s last hour.
At the moment, the Emini is Always In Long and it is testing yesterday’s high. However, since the two early bull bars had bear bars for their follow-through, this rally is probably a bull leg in a trading range. Therefore, the odds are that there will be a swing down starting by the end of the 1st hour. Since the reversal will be minor, the odds favor a trading range for the 1st 2 hours or so, and possibly all day. Yesterday was so strongly up that a bear trend day is unlikely.
Pre-Open market analysis
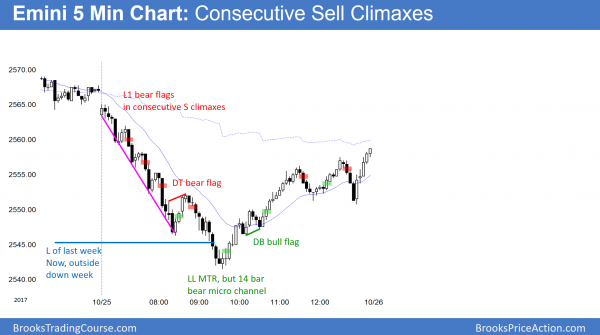
The Emini sold off strongly to below last week’s low, creating an outside down bar on the weekly chart. However, the bulls bought the new low aggressively and closed the day far above the low. When a weekly sell signal triggers, there is often a big reversal up above the sell signal price. Then, the Emini usually has to test that price again. Therefore, as strong as yesterday’s reversal up was, the Emini will probably test last week’s low again today or tomorrow.
The bears want his week to close below last week’s low. That would increase the chance of a reversal down to the weekly moving average. The bulls will try to keep Friday’s close above last week’s low. That will reduce the bearishness of the outside down week. Even with that, the weekly chart is extremely climactic. Consequently, the odds of much higher prices without a pullback are small.
October 26 through November 5 is a seasonally bullish window. With today’s reversal up, it slightly reduces the chances that the Emini is pulling back. In addition, since the daily chart is in a bull trend and most reversals fail, the odds continue to favor higher prices. Yet, the buy climaxes on the weekly and monthly charts are extreme. Therefore, while the odds continue to favor higher prices, the odds are that the upside is limited and the the Emini will pullback 100 points soon.
Daily and weekly sell signals
By breaking below the ioi on the daily chart, the Emini triggered a daily sell signal. As long as the rally stays below the top of Tuesday’s high, the sell is still in effect. This is true even after yesterday’s strong rally.
Yesterday also triggered a weekly sell by making this week an inside down week. When a market falls below last week’s low to trigger a sell signal, it often rallies back above that low. If the rally is not strong, the Emini then usually falls again below last week’s low. There is a 50% chance of a leg down and a 50% chance of a 2nd reversal up.
However, yesterday was a strong reversal up from below last week’s low. Therefore, the weekly chart is more likely to go sideways for another week or two than to go down. This Friday’s close is important. If it is below last week’s low, the bears will have regained control. They would then have about a 50% chance of follow-through selling over the next few weeks. In addition, the selloff would probably reach the 20 week EMA within a few weeks.
Overnight Emini Globex trading
The Emini is up 2 points in the Globex market. While yesterday was a big reversal day, it had a bear close. It is therefore a weak buy signal bar on the daily chart. Furthermore, it has been sideways for 3 weeks. This increases the odds of more trading range trading. Finally, yesterday was a Big Down, Big Up day. This creates confusion and increases the odds of a trading range day today.
Since yesterday had a big range and today will open around the middle 3rd, today has an increased chance of being and inside day. Furthermore, since a big bear doji is a low probability buy signal bar, if today goes above yesterday’s high, it will probably not get far above.
However, if the bears have taken control, they will try to make Friday’s close be below last week’s low. Therefore, despite yesterday’s strong rally, there is an increased chance of a selloff back down to yesterday’s low by the end of tomorrow.
Yesterday’s setups
Here are several reasonable stop entry setups from yesterday. I sometimes also show limit order entries and entries on the close of bars.
EURUSD Forex market trading strategies
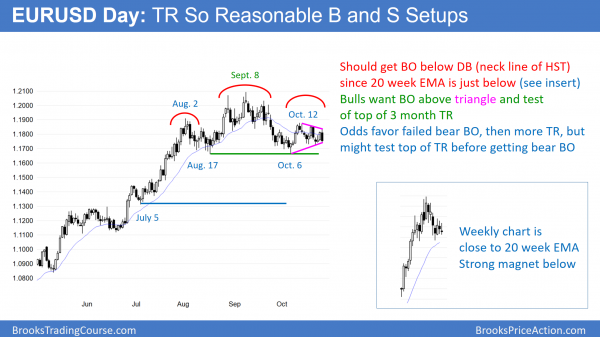
The EURUSD daily Forex chart in at the apex of a 3 week triangle. The weekly chart is close to its 20 week exponential moving average (see insert). Since that is a strong magnet, the market will probably get pulled to it soon.
The EURUSD daily chart has been in a tight trading range for a month. Since it now has lower highs and higher lows, it is also a triangle. It is therefore in breakout mode. Because the weekly chart is very close to its 20 week EMA, the odds are that it will have touch it before it can get to the top of the trading range.
It can get there by going sideways or a little down. If if goes down a little, it might fall below its 3 month trading range. That would trigger a head and shoulders top sell signal. There would then be a 40% chance of a measured move down to around the July 5 low just above 1.1300. More likely, the bear breakout will find support around the top of the 2 year trading range between 1.1500 and 1.1600.
Since the monthly rally is stalling at the bottom of its 10 year range around 1.2000, the odds are that the EURUSD will continue in a range for at least several more months. The bottom of the range will probably be between 1.1300 and 1.1600, and the top will be around the September high, near 1.2100.
Overnight EURUSD Forex trading
The 5 minute chart fell 70 pips over the past hour. Today is now an outside down day. However, because it is in a tight trading range, an outside day has little predictive value. The odds favor repeated reversals. More important is the magnet of the weekly EMA, which is just below the 2 month range.
When a market has a strong selloff like the one over the past hour, there is at least a 60% chance of a 2nd leg sideways to down. However, context is important. Since this selloff is a test of the bottom of a 3 week triangle, it might be simply a 2nd leg trap. The 1st leg was a 5 hour bull flag that formed last night. A 2nd leg trap is a strong 2nd leg near the bottom or top of a trading range that traps breakout traders into entering in the direction of the breakout. However, since the breakout did not go beyond the range, it is minor and reverses back up almost 50% of the time.
Most trading range breakout attempts fail
Even if this is a trap, there is usually at least a small 2nd leg sideways to down before the bulls can get a reversal up. Therefore, bears will sell the 1st rally. If the selloff forms a double bottom, bulls would then buy a reversal up. Most likely, today will be another mostly sideways day. However, the strong selloff reduces the odds of a big rally.
The bears need follow-through selling over the next hour or two before traders will believe that the breakout below the 3 week triangle will lead to a measured move down. The double top and double bottoms of the triangle are about 130 pips tall. A measured move down will fall to below the weekly EMA, which is the target below.
Summary of today’s S&P Emini futures price action and what to expect tomorrow
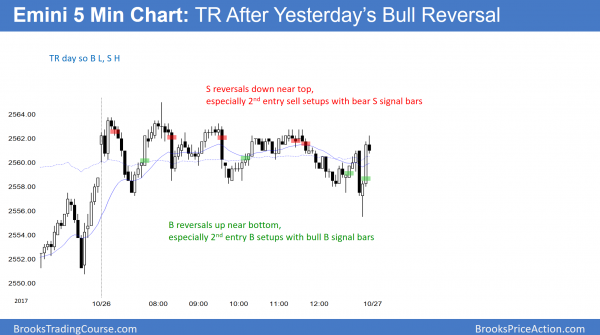
After yesterday’s big reversal, a trading range day was likely today. Today was a small inside day that closed near the open. It was therefore a doji day.
Today was a trading range day after yesterday’s strong bull reversal. It is slightly more likely to be a bull flag than a major trend reversal. However, yesterday was a weak buy signal bar. Therefore, a breakout above will probably not get far.
Tomorrow is Friday and therefore weekly support and resistance are important, especially in the final hour. Since this week is an outside down week, the most important prices are last week’s high and low. The next most important is the midpoint of the week and the open of the week. If the bulls cannot get back above last week’s high and the bears cannot get back below last week’s low, the fight will then be in the middle. The bears want a bear body and a close below the middle. The bulls want a bull body and a close above the middle.
See the weekly update for a discussion of the price action on the weekly candlestick chart and for what to expect going into next week.
Traders can see the end of the day bar-by-bar price action report by signing up for free at BrooksPriceAction.com. I talk about the detailed S&P Emini futures price action real-time throughout the day in the BrooksPriceAction.com trading room. We offer a 2 day free trial.
When I mention time, it is USA Pacific Standard Time (the Emini day session opens at 6:30 am PST, and closes at 1:15 pm PST). You can read background information on the intraday market reports on the Intraday Market Update page.


