Trading Update: Friday December 17, 2021
Emini pre-open market analysis
Emini daily chart
- Yesterday was a big bear day after a big bull day on Wednesday. Yesterday’s low was above Wednesday’s low.
- Emini bulls want breakout above November all-time high. The bulls hope that yesterday was just a deep pullback from Wednesday’s rally. They want the year to close at a new high.
- The bears want yesterday to be the start of a reversal down from a double top with the November 22 high.
- Remember, as long as December stays below the November high, the Emini is still on a Low 2 top sell signal on the monthly chart.
- The bull trend on the daily, weekly, and monthly charts make a new high more likely than a reversal down to below the November low. There is enough time remaining in December for the Emini to pull back a little more and still end the year at a new high.
- But if the bears can get a few consecutive big bear days, the odds will favor a test of the December low before there is a new high.
Emini 5-minute chart and what to expect today
- Emini is down 30+ points in the overnight Globex session. It will gap down.
- However, yesterday was a sell climax day. That means there is a 75% chance of at least a couple hours of sideways to up trading beginning by the end of the 2nd hour today.
- Today is Friday so weekly support and resistance are important, especially in the final hour.
- The bears want a bear bar on the weekly chart. They want it to close near the low of the week, which is unlikely. At a minimum, they want it to close below the midpoint.
- The closer to the low of the week that it closes, the less likely the Emini will finish the year at a new high.
- The bulls want the week to have a bull body. With the Emini currently about 70 points below the open of the week, that is unlikely. At a minimum, they want the week to close above its midpoint. That would increase the chance of sideways to up trading next week.
Yesterday’s Emini setups

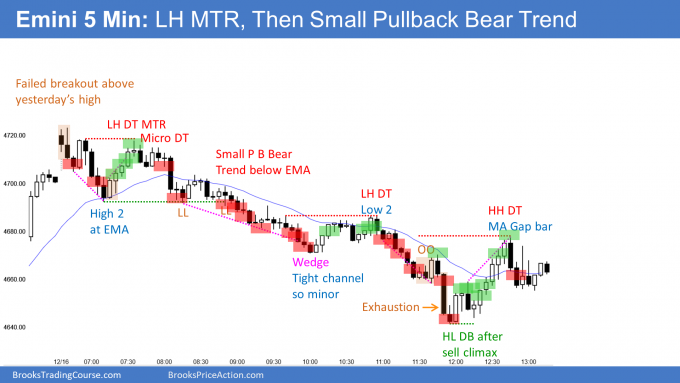
Here are several reasonable stop entry setups from yesterday. I show each buy entry with a green rectangle and each sell entry with a red rectangle. Buyers of both the Brooks Trading Course and Encyclopedia of Chart Patterns have access to a much more detailed explanation of the swing trades for each day (see Online Course/BTC Daily Setups).
My goal with these charts is to present an Always In perspective. If a trader was trying to be Always In or nearly Always In a position all day, and he was not currently in the market, these entries would be logical times for him to enter. These therefore are swing entries.
It is important to understand that most swing setups do not lead to swing trades. As soon as traders are disappointed, many exit. Those who exit prefer to get out with a small profit (scalp), but often have to exit with a small loss.
If the risk is too big for your account, you should wait for trades with less risk or trade an alternative market like the Micro Emini.
EURUSD Forex market trading strategies
EURUSD Forex daily chart

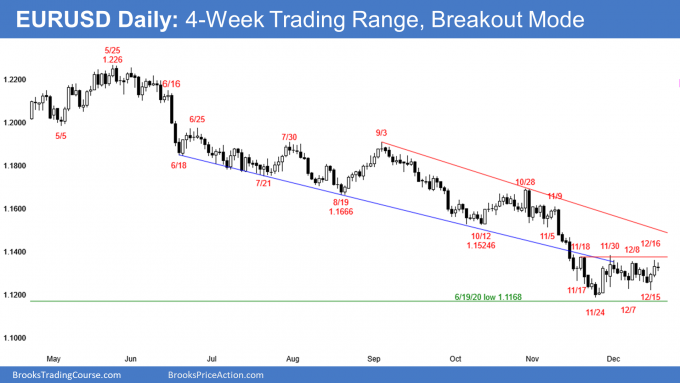
- Tight trading range for a month so Breakout Mode. That means 50% chance of a successful breakout in either direction, and a 50% chance that the 1st breakout attempt will fail.
- Every trading range always has both buy and sell signals.
- Yesterday was the entry bar for Wednesday’s small double bottom buy signal. The bulls hope it is a base that will lead to a reversal up.
- However, the bulls need bigger bars and a couple closes far above the trading range before traders conclude that a bull trend has begun. Yesterday was a small bull bar with a prominent tail on top and today so far is a small doji inside bar.
- The bears hope the month-long trading range is a bear flag and will lead to another leg down. They want a reversal down today or Monday for another attempt at a double top. This time, with the December 8 high.
- Whether or not there is a new low and a test of the June 19, 2020 higher low, traders should expect a rally for at least a couple months to begin here or from a little lower.
- The EURUSD has been in a trading range for 7 years. The current leg down has lasted a year, which is a long time. Traders should expect a bounce soon.
- Currency reversals are more common at the start of the year. The current bear trend began on January 6 of this year. Traders should be ready for a possible reversal up in early January.
- There is only a 30% chance that this selloff will continue down to last year’s low without a rally of at least for a couple months.
- Today is Friday so weekly support and resistance can be important, especially at the end of the day. So far, this week is the 4th consecutive doji bar on the weekly chart.
- The more the week closes on the high and the bigger the bull body, the more likely next week will be high.
- If there is a bear body, the bigger it is, the more likely next week will trade lower.
- Most likely, the body will remain small and traders will try again next week for a breakout.
Summary of today’s S&P Emini futures price action and what to expect tomorrow

End of day summary
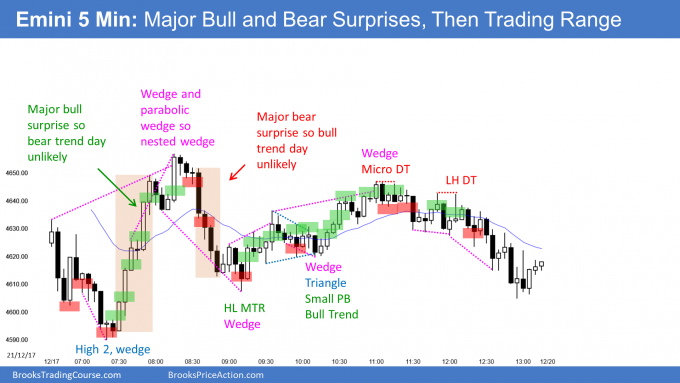
- The Emini gapped down and sold off to the 50-day MA and to below the FOMC low, the 4600 Big Round Number, and the earlier low of the week.
- It then reversed up violently in a Major Bull Surprise to test the 60-minute EMA and the midpoint of the week. A Major Bull Surprise makes a bear trend day unlikely.
- Extreme buy climaxes like that typically lead to trading ranges, and this one did as well.
- However, the selloff from the high was greater than what was likely. It was a Major Bear Surprise, which made a bull trend day unlikely.
- With a bear trend and a bull trend both unlikely, traders got a trading range. The trading range centered around the open of the day and the middle of the day’s range.
- On the daily chart, today formed a lower low double bottom with Tuesday’s low. It is a bear follow-through bar after yesterday’s big bear bar.
- However, it closed above Tuesday’s low and the selloff is not yet as strongly bearish as it could be. Because it was a bear doji bar, it is fairly neutral. It is not a high probability High 1 buy signal bar for Monday.
- The odds still slightly favor a new high by the end of the year and possibly above 4800. However, if the bulls do not start to get bull bars closing near their highs next week, the Emini will probably not make a new high this year. Instead, it might trade down to the December low.
- On the weekly chart, today closed near its low. It is a sell signal bar for a micro double top with the high of 4 weeks ago.
- However, the bull trend has been strong and the weekly chart has been sideways for 7 weeks. This is not a high probability sell setup. The odds favor more sideways trading next week.
- Traders might be waiting for the last week of the year before deciding if the year will close at a new high, at the December low, or in the middle.
See the weekly update for a discussion of the price action on the weekly chart and for what to expect going into next week.
Trading Room
Traders can see the end of the day bar-by-bar price action report by signing up for free at BrooksPriceAction.com. I talk about the detailed S&P Emini futures price action real-time throughout the day in the BrooksPriceAction.com trading room. We offer a 2 day free trial.
Charts use Pacific Time
When I mention time, it is USA Pacific Time. The Emini day session charts begin at 6:30 am PT and end at 1:15 pm PT which is 15 minutes after the NYSE closes. You can read background information on the market reports on the Market Update page.

