Trading Update: Friday December 8, 2023
S&P Emini pre-open market analysis
Emini daily chart
- The Emini rallied yesterday, testing Wednesday’s high. The moving average is getting closer to the current price.
- This increases the odds that the market will have difficulty going much higher, without reaching the moving average first.
- The market will probably reach the moving average over the next few days.
- The November rally has been strong and the market is Always In Long. However, traders must remember that the daily chart is in a large trading range. This increases the risk of a deeper pullback than what the bulls want. One possible target is the October 17th breakout point high.
- If the bears take control, they will first need to get a successful breakout below the moving average. Until then, traders will assume buyers will be at the moving average.
Emini 5-minute chart and what to expect today
- Emini is down 11 points in the overnight Globex session.
- The Emini formed a large doji bar during the Unemployment report at 8:30 AM EST. This increases the odds of a trading range open during the U.S. Session.
- Traders should be cautious on the open and consider waiting for 6-12 bars unless they are quick to make decisions. Most of the time, the open will have a lot of two-sided trading, which increases the risk of getting trapped on a failed breakout.
- By waiting for 6-12 bars, a trader gains certainty on the day’s structure and will have a higher probability of catching the high or low of the day.
- Most traders should look for a swing trade on the open. It is common for the opening swing to begin before the end of the second hour, following a double top/bottom, or a wedge top/bottom.
- Today is Friday so weekly support and resistance are important. Traders should be prepared for a surprise breakout late in the day as the market decides on the close of the weekly chart.
- The most essential thing on the open is to be patient. The range is usually big on the open and contracts during the middle of the day. This means that if a trader takes a couple of big losses on the open it can be very difficult to make up the losses.
- Lastly, traders must always pay attention to risk. Generally, most traders should never risk more than 1% on any short-term trade.
Emini intraday market update
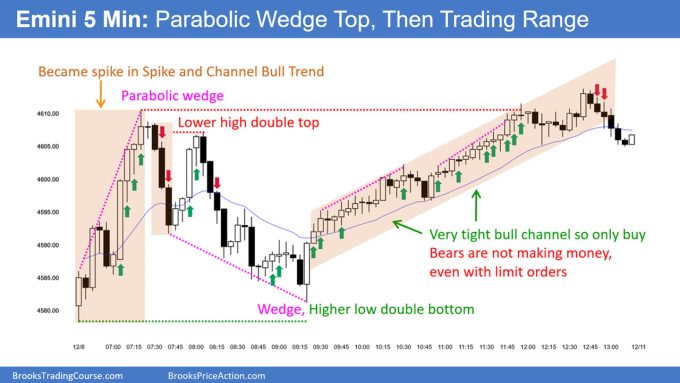
- The Emini rallied during the first few bars of the day.
- The Bulls formed a strong second leg up during bars 7-8, breaking out above last week’s high.
- Bars 11- 12 formed a possible parabolic wedge on the open, and the market sold off sharply during bars 12-14.
- While the selloff to bar 14 was strong, it was a trendline break of the rally up to bar 11. This increased the odds that the selloff to bar 14 would lead to a trading range and sideways trading.
- The market retested the highs of bar 12 during bar 18, which was a High 1 buy setup. This led to disappointed bulls selling out of longs and a sharp selloff during bars 19-22.
- The breakout down to bar 22 was strong enough for two to three legs down and a test of the day’s open.
- Bar 34 found strong buying at the day’s open (bar low) and reversed up, closing on its high. This was enough of a surprise to increase the odds of a couple of legs sideways to up.
- As of bar 55, the market is in a tight bull channel, testing near bar 19’s close. Bar 19 is important because it is in the general area where the bulls got trapped buying and betting on a second leg up after the bar 18 rally.
Yesterday’s Emini setups

Al created the SP500 Emini charts.
Here are reasonable stop entry setups from yesterday. I show each buy entry bar with a green arrow and each sell entry bar with a red arrow. Buyers of both the Brooks Trading Course and Encyclopedia of Chart Patterns have access to a near 4-year library of more detailed explanations of swing trade setups (see Online Course/BTC Daily Setups). Encyclopedia members get current daily charts added to Encyclopedia.
My goal with these charts is to present an Always In perspective. If a trader was trying to be Always In or nearly Always In a position all day, and he was not currently in the market, these entries would be logical times for him to enter. These therefore are swing entries.
It is important to understand that most swing setups do not lead to swing trades. As soon as traders are disappointed, many exit. Those who exit prefer to get out with a small profit (scalp), but often have to exit with a small loss.
If the risk is too big for your account, you should wait for trades with less risk or trade an alternative market like the Micro Emini.
EURUSD Forex market trading strategies
EURUSD Forex daily chart

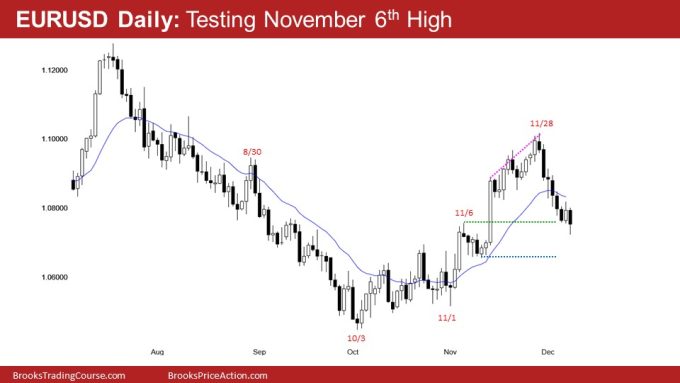
- The EURUSD pulled back yesterday after testing the November 6th breakout point high.
- The bears sold the first break of the bear microchannel, which led to a selloff and test below yesterday’s low.
- The market will probably begin to find support near the November 14th low (big bull breakout bar).
- The next target for the bears is the November 10th low, which is the blue dashed line just below.
- Because the selloff down from the November high is tight, the odds are that any rally will lead to a trading range, not a strong upside breakout above the November 28th high.
- Overall, the market will probably have to rally for a couple of legs before the bears get a second leg down. One possible magnet will be a midpoint of the November 28th selloff (1.0867).
Summary of today’s S&P Emini price action

Al created the SP500 Emini charts.
End of day video review
End Of Day Review will be presented in the Trading Room today. See below for details on how to sign up.
See the weekly update for a discussion of the price action on the weekly chart and for what to expect going into next week.
Trading Room
Al Brooks and other presenters talk about the detailed Emini price action real-time each day in the BrooksPriceAction.com trading room days. We offer a 2 day free trial.
Charts use Pacific Time
When times are mentioned, it is USA Pacific Time. The Emini day session charts begin at 6:30 am PT and end at 1:15 pm PT which is 15 minutes after the NYSE closes. You can read background information on the market reports on the Market Update page.

