Trading Update: Friday March 4, 2022
Emini pre-open market analysis
Emini daily chart
- Yesterday is a Low 2 sell signal bar at the 20-day EMA, but it will probably only lead to a minor reversal and a higher low. It is a bear bar closing near its low.
- The bears hope the 6-day rally is just a sharp leg up in the bear channel that began on January 4.
- But the reversal up was extremely strong and it was the 2nd strong reversal up. That buying pressure increases the chance of higher prices.
- Why hasn’t the follow-through been better after the 2 big bull days? That’s because of risk. The stop for the bulls is below the February 24 low, which means there is too much risk for traders buying at the current price.
- Many traders want to buy, but not at this price. That increases the chance of the Emini trading below a 50% pullback of the rally. For example, it might retest the January 24 low.
- Since the odds are that the low is in for the next several months and possibly all year, a sharp selloff down to the January 24 low will probably reverse up and form a higher low major trend reversal buy signal.
- If there is a new low, it probably will be brief. Traders would look for a wedge bottom reversal, where the 1st 2 lows were January 24 and February 24
- This rally is strong enough so that the Emini should get back to the February 2 high before breaking below the February 24 low. Once there, traders will find out if the 8-month trading range will continue or if the rally will break strongly above that major lower high and continue up to a new all-time high.
- This week is the entry bar on the weekly chart for a High 2 bottom.
- The bulls want a big bull bar closing on its high. With only one day left, they probably will not get it.
- At a minimum, they want the week to have a bull body. They prefer that it closes on the high of the week and above last week’s high. The bigger the bull bar, the more likely next week will be higher.
- The bears want the buy signal to fail. They want the week to be a bear bar closing on its low so that this week will be a Low 1 sell signal bar.
- While this week might be a bear bar, it will probably not be a big enough bear bar to completely erase the buy signal. For example, there is not much chance of it being an outside down bar that closes below last week’s low.
- If the week’s range remains small and the week closes around the open of the week, traders will expect more sideways trading next week. Next week would probably trade below this week’s low but not below the February 24 low.
- Late last year, I said that the monthly chart formed a micro wedge and that it should lead to 2 bear bars. I said 3 was less likely. February was the 2nd bear bar, and that increases the chance that the selling has ended.
- The end of selling can lead to either a trading range or a bull trend. Traders will need several more weeks before they know which it will be.
- The Emini has been sideways for 8 months. That increases the chance of more sideways trading. It could last all year.
- However, as I said in my video about what to expect in 2022, there will probably be at least one more new high before the Emini begins a trading range that will last about a decade.
Emini 5-minute chart and what to expect today
- Emini is down 45 points in the overnight Globex session.
- Today is the last day of the week and weekly support and resistance can be magnets, especially in the final hour.
- The most important magnets are the open of the week and last week’s high.
- The bulls hope that yesterday’s double bottom will lead to a big bull day.
- However, if this week’s range remains small, next week will probably trade below this week’s low. If today is not a strong bull day, there is an increased chance that it will close near the low of the week.
Yesterday’s Emini setups

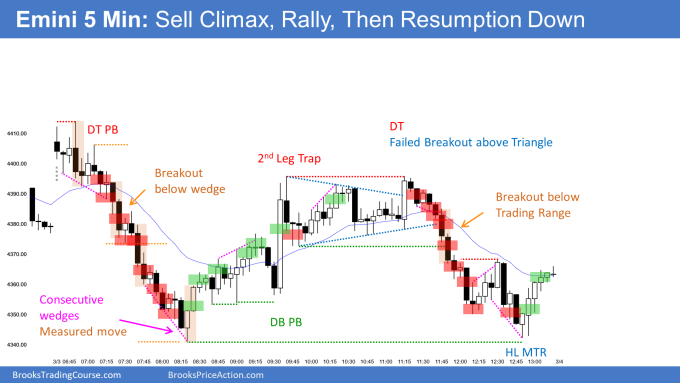
Here are several reasonable stop entry setups from yesterday. I show each buy entry with a green rectangle and each sell entry with a red rectangle. Buyers of both the Brooks Trading Course and Encyclopedia of Chart Patterns have access to a much more detailed explanation of the swing trades for each day (see Online Course/BTC Daily Setups).
My goal with these charts is to present an Always In perspective. If a trader was trying to be Always In or nearly Always In a position all day, and he was not currently in the market, these entries would be logical times for him to enter. These therefore are swing entries.
It is important to understand that most swing setups do not lead to swing trades. As soon as traders are disappointed, many exit. Those who exit prefer to get out with a small profit (scalp), but often have to exit with a small loss.
If the risk is too big for your account, you should wait for trades with less risk or trade an alternative market like the Micro Emini.
EURUSD Forex market trading strategies
EURUSD Forex daily chart

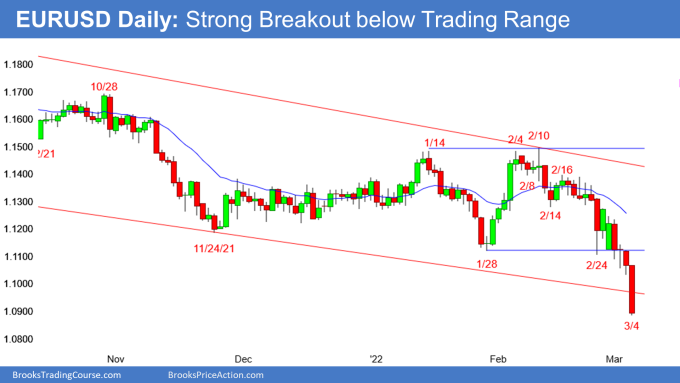
- Yesterday was the 3rd straight day that traded below the January 28 low, but only the 1st day to close below that low.
- I said that the bears need a 2nd consecutive bear day closing below that low to make traders conclude that the bear breakout will be successful.
- So far, today is a huge bear day and it is trading near the low.
- Today probably will remain a bear day, which will confirm the breakout. Traders will look for about a 400-pip measured move down to around the 2020 low.
- It is important to remember that most breakout attempts fail.
- Today is the 10th consecutive day where every high has been below the high of the prior day (micro channel). The selling has been relentless.
- Any breakout can fail. There is a 40% chance that this one will. The bulls need several bull bars closing near their highs before traders will see any reversal as more than a pullback in the bear trend.
Summary of today’s S&P Emini futures price action and what to expect tomorrow

End of day summary
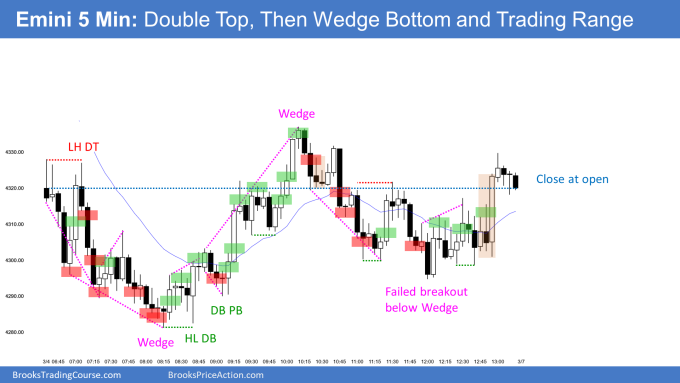
- Today oscillated around the open of the day and week all day. It closed at the open of the day and formed a perfect doji day.
- It closed just below the open of the week and this week therefore is a bear bar on the weekly chart and a Low 1 sell signal bar.
- Next week will probably trigger the weekly sell signal by falling below this week’s low. It might fall to around 4200 and test the January 24 low.
- There are just not enough buyers so far above the February low and the Emini might have to go lower to find them. They should come in above the February low and create a higher low major trend reversal.
- The February low will probably be the low for the next several months and possibly all year. If there is a new low in March or April, traders will buy it. A third reversal up would then create a wedge bottom, and that would likely be the low for many months.
- The Emini has been in a trading range for 8 months. If the low holds, the Emini might continue sideways for many more months.
- The bulls hope that the reversal up will lead to a new high. There should be at least one more new high before the bears can get a trend reversal on the monthly chart, even though there is a bear trend on the daily chart.
- However, the end of the selloff can lead to a trading range instead of a bull trend. Traders will find out over the next several weeks.
See the weekly update for a discussion of the price action on the weekly chart and for what to expect going into next week.
Trading Room
Traders can see the end of the day bar-by-bar price action report by signing up for free at BrooksPriceAction.com. I talk about the detailed S&P Emini futures price action real-time throughout the day in the BrooksPriceAction.com on trading room days. We offer a 2 day free trial.
Charts use Pacific Time
When I mention time, it is USA Pacific Time. The Emini day session charts begin at 6:30 am PT and end at 1:15 pm PT which is 15 minutes after the NYSE closes. You can read background information on the market reports on the Market Update page.

