Posted 7:31 a.m.
Today opened within the tight trading range from the end of yesterday and continued with tight trading range, limit order trading initially. This increased the chances that today will spend a lot of time within tight trading ranges, and it reduces the chances that today will become a trend day. If it does trend, the trend will probably be a weak trend like a trending trading range day or a broad channel. This lack of urgency on the open reduces the chances of a strong trend.
The bears want any rally to fail and for the Emini to test down to the bottom of yesterday’s channel at either 1965 or even 1956. The bulls want the rally to resume up to the 60 minute lower high around 1978.
Swing traders need a breakout with follow-through in either direction. Without it, day traders will continue to sell above bars and buy below, and they will scalp. Since the initial range has been small, the odds are that there will be a measured move up or down. At the moment, the Emini is slightly more bullish than bearish, but until there is a strong breakout, the odds for the bulls are not much better than those for the bears.
Pre-Open Market Analysis
S&P 500 Emini: Learn how to trade the markets after a buy climax
The Emini had a strong rally yesterday and because it was in a tight channel, it was climactic. Buy climaxes often have follow-through buying for an hour or two on the next day, but only a 30% chance of the buying lasting all day. There is a 70% chance that today will have at least a couple of hours of sideways to down trading today, and it should start within the 1st two hours.
As strong as yesterday’s rally was, traders learning how to trade the markets should notice that it failed to get below the September 9 lower high and the top of the 3 week trading range. The Emini will probably wait for tomorrow’s 11 am Fed interest rate announcement to attempt a breakout above or below the range. Because the August selloff was so unusually strong, there is a 60% chance of a test of the August low whether or not there is a breakout above the 3 week trading range.
The Globex market is currently trading around yesterday’s day session close, and overnight trading was within a tight range.
Forex: Best trading strategies
The moves became a little bigger yesterday going into the tomorrow’s Fed interest rate announcement. The 60 minute EURUSD had a wedge bear flag after a 2 week sell off, and last night had a 3rd push down from that bear flag. The odds are that the selling will stop and the overnight bear channel will convert into a trading range or swing up today that should last at least a couple of hours.
The EURJPY is should also try to rally today after breaking above a 60 minute bull flag and pulling back to test the breakout last night.
The USDJPY was strong overnight, but the rally is near the top of the 60 minute trading range of the past week, and it might stall soon and enter a trading range on the 5 minute chart.
The USDCAD daily chart remains one of the best with the potential for a swing of several hundred points that will probably begin over the next week or two. Day traders learning how to trade the markets should watch for a strong breakout up or down, and then look to enter. If the breakout fails, look to take the reversal trade.
Summary of today’s S&P Emini futures price action and what to expect tomorrow
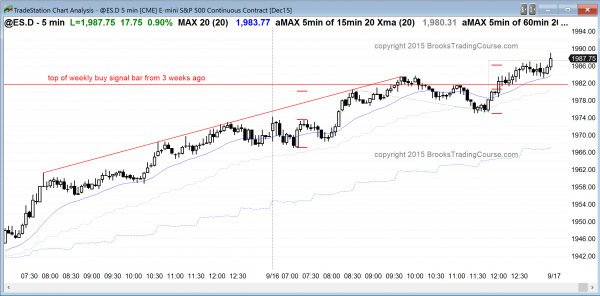
The Emini had a trending trading range day and closed above the weekly buy signal bar from 3 weeks ago.
The Emini finally triggered the buy signal on the weekly chart by going above the buy signal bar from 3 weeks ago. The breakout on the weekly chart is small so far. Tomorrow will probably have a big move up or down or in both directions after the FOMC report at 11 a.m. For the bulls, they might get a big move up toward the 2030 bottom of the 7 month trading range. The bears want a strong reversal down from the breakout above the 3 week trading range and the weekly buy signal bar. Although the Emini is entering the report with the bulls in control, that can change instantly after the report, and traders should be open to a strong move in either direction.
See the weekly update for a discussion of the price action on the weekly candlestick chart and for what to expect going into next week.
Traders can see the end of the day bar-by-bar price action report by signing up for free at BrooksPriceAction.com. I talk about the detailed S&P Emini futures price action real-time throughout the day in the BrooksPriceAction.com trading room, and a 2 day free trial is available.
When I mention time, it is USA Pacific Standard Time (the Emini day session opens at 6:30 am PST, and closes at 1:15 pm PST). You can read background information on the intraday market reports on the Intraday Market Update page.


