Trading Update: Wednesday June 16, 2021
Emini pre-open market analysis
Emini daily chart
- Even though buy climaxes on weekly and monthly charts, no credible top, so odds favor higher prices. June FOMC report at 11am PT today.
- Tight bull channel on daily chart for 4 weeks, so traders continue to expect higher prices. They will continue to buy 1- to 3-day selloffs until there is a very strong reversal down.
- Yesterday’s high was below Monday’s all-time high, and yesterday’s low was above Monday’s low, so yesterday was an inside day. Both buy and sell signal bar.
- Sell signal bar for failed breakout above May 7 high, but tight bull channel for 4 weeks. Minor sell setup.
- High 1 buy signal bar but bear body. Minor buy setup.
Emini 5-minute chart and what to expect today
- Emini is up 1 point in the overnight Globex session.
- Yesterday formed a trading range around the open of the week, so that is a magnet.
- June FOMC report at 11 am PT today. Since more signs of inflation, more potential for a change in the Fed’s wording.
- This increases the chance of a big move after the report. It could be in either direction, and it also could reverse and form an opposite big move.
- Because of potential for big move after any 11 am PT FOMC report, day traders should exit positions ahead of report.
- Since there is usually a big move in both directions in 1st few minutes after report, day traders should wait at least 10 minutes after the report before resuming trading.
- Very little correlation between the moves before and after the report. Trade what happens after the report as if it is the start of a new day.
- Ahead of the report, be open to anything. Yesterday had a lot of trading range trading, as do most days. Day traders will expect reversals.
- If there is a series of strong trend bars, day traders will look for a trend, but they should exit ahead of report.
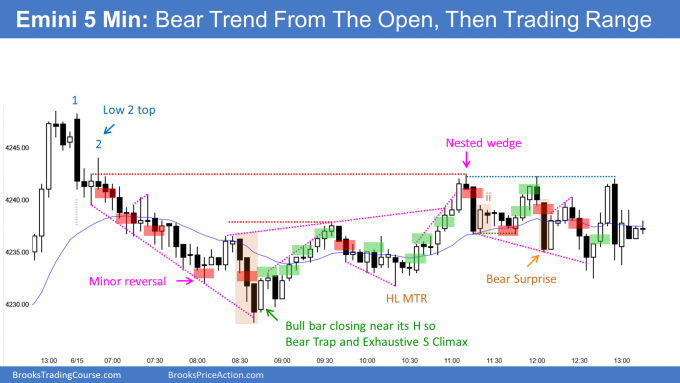
Yesterday’s Emini setups

Here are several reasonable stop entry setups from yesterday. I show each buy entry with a green rectangle and each sell entry with a red rectangle. Buyers of both the Brooks Trading Course and Encyclopedia of Chart Patterns have access to a much more detailed explanation of the swing trades for each day (see Online Course/BTC Daily Setups).
My goal with these charts is to present an Always In perspective. If a trader was trying to be Always In or nearly Always In a position all day, and he was not currently in the market, these entries would be logical times for him to enter.
If the risk is too big for your account, you should wait for trades with less risk or trade an alternative market like the Micro Emini.
EURUSD Forex market trading strategies
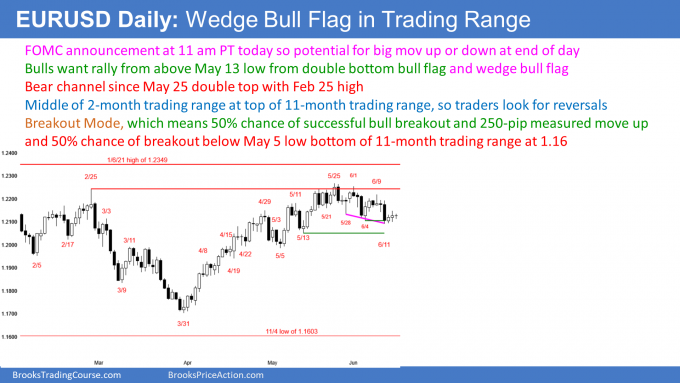
EURUSD Forex daily chart

- Wedge bull flag since May 28.
- Yesterday triggered wedge buy signal by going above Monday’s high.
- Breakout was small and yesterday closed around Monday’s high instead of far above it. This is a weak entry for the bulls.
- Traders are still deciding if 3-week selloff is a bull flag in the bull trend that began on May 13. The bears hope it is a trend reversal down.
- Nested trading ranges on daily, weekly, and monthly charts, so traders expect reversals.
- Trading ranges tend to break below support, and above resistance before reversing.
- This selloff might need to fall below the May 13 low, before the bulls will buy again.
EURUSD Forex trading on 5-minute chart
- Small trading range so far today. Day traders are scalping in both directions.
- There is the June FOMC report at 11 am PT today. Since it can result in a big move in all financial markets, day traders should exit ahead of the report.
- There is usually a quick move up and down after the report. Day traders should wait at least 10 minutes before resuming trading.
- They should be open to anything, which means a strong trend in either direction, as well as a reversal.
Summary of today’s S&P Emini futures price action and what to expect tomorrow

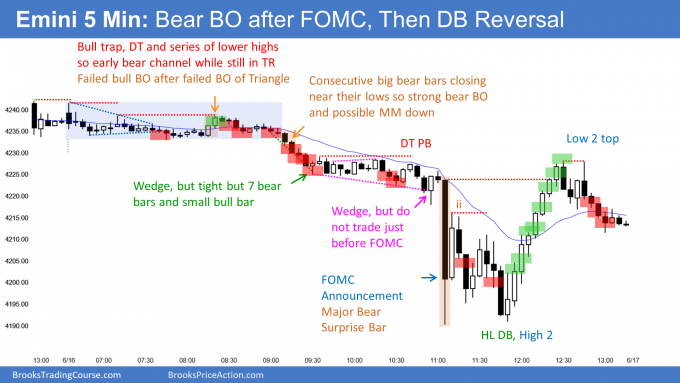
Here are several reasonable stop entry setups for today. I show each buy entry with a green rectangle and each sell entry with a red rectangle. Buyers of both the Brooks Trading Course and Encyclopedia of Chart Patterns have access to a much more detailed explanation of the swing trades for each day (see Online Course/BTC Daily Setups).
My goal with these charts is to present an Always In perspective. If a trader was trying to be Always In or nearly Always In a position all day, and he was not currently in the market, these entries would be logical times for him to enter.
If the risk is too big for your account, you should wait for trades with less risk or trade an alternative market like the Micro Emini.
End of day summary
- Today had an FOMC announcement at 11 a.m. PT.
- Ahead of the FOMC announcement, there was a triangle and trading range open. A small bear breakout failed and then a bull breakout also failed.
- The bears got a successful bear breakout and a measured move down to below yesterday’s low. It was also a test of the May 7 high, which is the breakout point on the daily chart. Additionally, it was a test of the open of the month.
- After the FOMC announcement, the Emini formed a Major Bear Surprise Bar.
- However, It then rallied from a double bottom to above the top of the bear bar. That erased most of the bearishness of the big bear bar.
- The selloff fell below last week’s low so this week is now an outside down bar on the weekly chart.
- The selloff also broke below the May 7 high and the open of the month.
- The reversal back up went above both of those key prices, but today closed slightly below both.
- Today is a High 1 buy signal bar on the daily chart, but it has a bear body and the Emini has been in a tight trading range for a couple weeks. This is a weak buy setup.
- The bears want this to be the start of a correction, but most reversals fail. Therefore, the bears need strong follow-through selling before traders will look for lower prices on the daily chart.
See the weekly update for a discussion of the price action on the weekly chart and for what to expect going into next week.
Trading Room
Traders can see the end of the day bar-by-bar price action report by signing up for free at BrooksPriceAction.com. I talk about the detailed S&P Emini futures price action real-time throughout the day in the BrooksPriceAction.com trading room. We offer a 2 day free trial.
Charts use Pacific Time
When I mention time, it is USA Pacific Time (the Emini day session opens at 6:30 am PT, and closes at 1:15 pm PT). You can read background information on the intraday market reports on the Market Update page.

