Emini island top after island bottom in 3 month trading range
I will update again at the end of the day
Pre-Open market analysis
I said before the open yesterday that there was an increased chance of a bear trend day after 3 days in a tight bull channel on the 5 minute chart. Furthermore, the 3 week rally is a Small Pullback Bull trend. Hence, the odds are that any reversal will only last a couple of days. The probability is that the rally will continue up to 2800 before falling below the April low.
However, since the daily chart is in a 3 month trading range, any pullback can be deep. In addition, it could last a week or more. Therefore, it can make traders wonder if it is a reversal instead of a bull flag. Even if it does, the bulls will likely buy it and create a higher low.
By closing the gap below Tuesday’s low, the bears ended the island bottom. In addition, since yesterday gapped down, it created a 2 day island top. Island tops and bottoms are common in trading ranges. They therefore do not have much significance. Yet, the 3 week island bottom at major support is a more important sign than a 2 day island top. The probability still favors the bulls.
Weekly support and resistance
Today is Friday and therefore weekly support and resistance are important. The most important price is the open of the week at 2675.25. This is because a close below that will turn the week into a bear bar on the weekly chart. The bears will then see this week as a sell signal bar for next week.
Alternatively, the bulls not only want a bull body, they want the week to close on its high. However, that is probably too far above. At a minimum, they want the bar on the weekly chart to have a bull body. That means a close above the open of the week.
Overnight Emini Globex trading
The Emini is down 1 point in the Globex session. The bulls want a 2nd leg up from yesterday’s strong rally in the final hour on the 5 minute chart. But, the bears want it to be a blow-off top and the start of a swing down.
Today will provide useful information. If the bulls can prevent a strong break below yesterday’s low, yesterday will simply be another small, brief pullback in a 3 week Small Pullback Bull Trend. On the other hand, if the bears can get strong bear trend days today and Monday, the Emini will probably retrace more than 50% of the 3 week rally within 2 weeks.
Since the past 8 days have been mostly sideways, the odds favor another trading range day today. The open of the week is the key price. It is below yesterday’s low and 17 points below yesterday’s close. It therefore might be too far below for the bears to get there today. Consequently, the odds are that the week will end up as a small bull trend bar on the weekly chart.
Yesterday’s setups
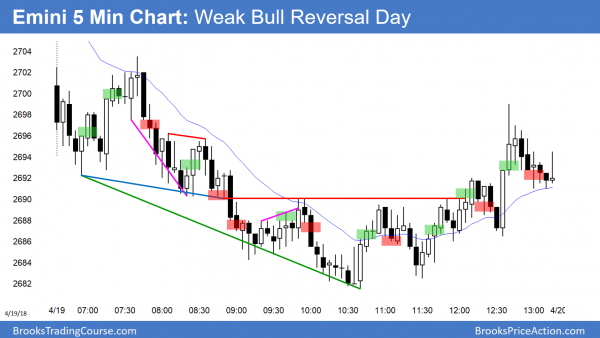
Here are several reasonable stop entry setups from yesterday. I sometimes also show limit order entries and entries on the close of bars.
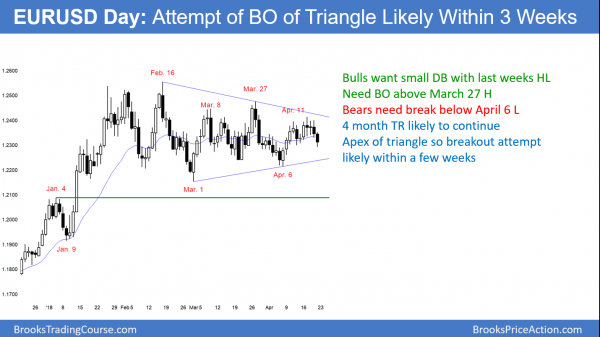
EURUSD 2 week tight trading range in 3 month Triangle
The EURUSD daily Forex chart is in the middle of a triangle and at its apex. The odds are that it will break out up or down within a few weeks.
The EURUSD daily Forex chart had an outside down day yesterday and is trading below yesterday’s low. It did not reach the bear trend line at the top of the triangle. Yet, it can still get there by going sideways.
The key prices on the daily chart are the March 27 major lower high and the April 6 major higher low. A break beyond either will be a breakout of the triangle. However, 50% of triangle breakouts fail and reverse. Traders want the breakout to have consecutive strong trend bars and 2 closes beyond the key prices. Without that, they will quickly look for a reversal.
Once there is a breakout, the chart would still be in its 4 month trading range. Traders need to see a strong break above the February 16 high or below the March 1 low. But, markets have inertia. That means that they are resistant to chance. Consequently, they repeatedly have strong legs up and down that reverse instead of leading to trends. Therefore, the probability is always higher when betting on reversals until there is a clear, strong breakout.
Overnight EURUSD Forex trading
The EURUSD 5 minute chart sold off yesterday and is now testing below the April 12 low. The bulls will try to rally up from below that low today. However, the 60 pip overnight selloff was a strong breakout. The rally of the past 2 hours is therefore a bear flag. Consequently, the chart will probably test the overnight low within an hour or two.
Since a bear flag late in a bear trend is usually the final bear flag, a bear breakout will probably fail. Then, the bear trend will evolve into a trading range, which is likely today. Therefore, day traders will probably only scalp today.
This is especially true since the bears have achieved a reasonable goal overnight. If the chart simply stays around 1.23 today, the bar on the weekly chart will be a bear reversal bar. Hence, it will be a reasonable sell signal bar for next week.
But, look to the left. The weekly chart has reversed every 1 – 2 weeks for 4 months. Therefore, a sell signal bar is more likely to lead to a 1 week selloff than a bear trend. Until there is a breakout, traders will keep looking for reversals.
Summary of today’s S&P Emini futures price action and what to expect tomorrow
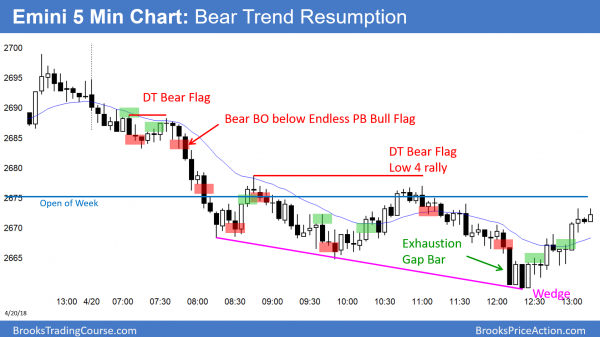
The Emini traded down for the 3rd consecutive day and broke below the open of the week. After an early sell climax, there was trend resumption down at the end of the day.
The Emini had a climactic selloff that led to a trading range. The bears then got trend resumption down. Today was the 3rd consecutive bear bar on the daily chart. Consequently, the bears will sell above today’s high for at least a small 2nd leg sideways to down.
See the weekly update for a discussion of the price action on the weekly candlestick chart and for what to expect going into next week.
Traders can see the end of the day bar-by-bar price action report by signing up for free at BrooksPriceAction.com. I talk about the detailed S&P Emini futures price action real-time throughout the day in the BrooksPriceAction.com trading room. We offer a 2 day free trial.
When I mention time, it is USA Pacific Standard Time (the Emini day session opens at 6:30 am PST, and closes at 1:15 pm PST). You can read background information on the intraday market reports on the Intraday Market Update page.


