Emini is in Breakout mode on the daily and weekly charts
Updated 6:45 a.m.
The Emini broke above yesterday’s bear channel, but immediately stalled at all of the resistance around the open of the week. It is a trading range open in the middle of a 4 day trading range, and in a cluster of magnets. This is probably going to be another trading range open. That means that the Emini will probably go sideways for the 1st hour before it decides on the direction of the 1st 2 – 3 hour swing. It always makes a trading range day more likely. That means that there will probably be an opposite swing after 2 – 3 hours.
At the moment, the big gap up after yesterday’s reversal up makes the market Always In Long. However, unless the bulls get a strong breakout with follow-through, the odds favor an early trading range. The bears need a strong reversal down, but there is support below at the EMA and yesterday’s close. They need a strong break below.
Pre-Open market analysis
Yesterday closed near its open and therefore was a doji day. Furthermore, it was an inside day. There is now an ioi Breakout Mode setup on the daily chart. However, the 4 day tight trading range is probably a bull flag after a strong 6 day rally. Less likely, it is the resumption of the January bear trend after a double top with the February 7 lower high.
Today is Friday . The most important magnets are the open of the week and last week’s high. The week will probably be the 2nd consecutive inside bar on the weekly chart. That would create an ii Breakout Mode pattern on the weekly chart for next week.
Many magnets around 2725
The odds are that the Emini will stay in the 4 day range today and be another mostly sideways day. It will probably focus on the open of the week, yesterday’s high, the 20 day EMA, the 20 bar EMA on the 60 minute chart, and the February 7 lower high today. These are all clustered around 2720 – 2730, which is therefore a strong magnet. All are above the current price. Therefore, the odds favor at least a small rally today.
The Emini will probably get drawn there today, but then have a difficult time breaking free of that area. If it is within about 10 points of the open of the week in the final hour, it might get drawn there by the end of the day. If so, that would create a perfect doji bar on the weekly chart and be an expression that the market is neutral. The developing ii on the weekly chart is also a sign of balanced bulls and bears. The Emini would then wait for next week for a breakout up or down.
Overnight Emini Globex trading
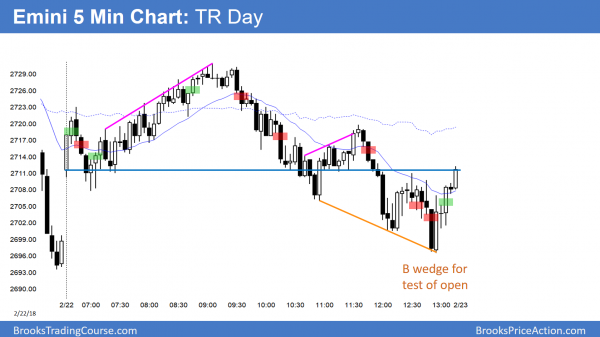
The Emini is up 8 points in the Globex market after yesterday’s late reversal up from a wedge bottom. The bulls are hoping that yesterday formed a double bottom with Wednesday’s low. Yesterday’s high is the neck line. A measured move up would break above last week’s high and trigger the buy signal on the weekly chart. That is unlikely today because of the lack of energy over the past 4 days. Last week’s high is 35 points above, and it is probably too far for the bulls to reach today.
The bears want a break below the 2 day double bottom. However, the lack of energy this week reduces the chances of a strong break below the 4 day bull flag. Furthermore, the 6 day rally prior to this 4 day bull flag makes a bull breakout more likely. However, the breakout will probably come next week. Today will probably get drawn up to all of the magnet between 2720 and 2730, but have a hard time breaking out of that area.
Yesterday’s setups
Here are several reasonable stop entry setups from yesterday. I sometimes also show limit order entries and entries on the close of bars.
EURUSD sideways again today
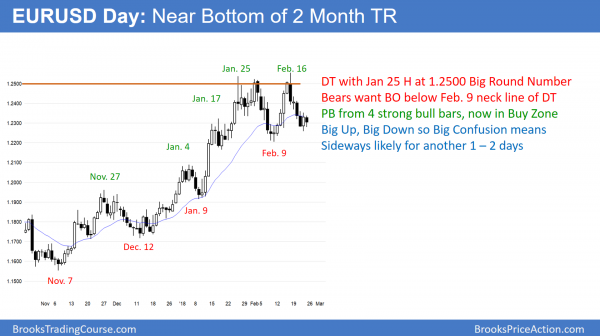
The EURUSD daily Forex chart has been in a trading range for 2 months. It has gone sideways for 3 days and is near the bottom of the range.
The EURUSD daily Forex chart traded down for 5 days to a higher low in a 2 month trading range. The bars have not been big and yesterday had a bull body. It has been sideways for 3 days. The bears want this pause to be a bear flag after a 4 day selloff. They then want a breakout below the flag and below the bottom of the 2 month range. However, there is not much momentum. In addition, trading ranges resist breaking out. Consequently, if the bears get a break below the 3 day bear flag, it will probably fail.
The bulls see the 3 sideways days as an attempt to form a micro double bottom. While they ultimately want a break above 1.25 and the top of the range, there is no indication yet that they are ready to buy aggressively all off the way to the top of the range and then above. More likely, they will get a bounce back up to the middle of the 300 pip tall range over the next few days. This is true even if the bears get a 1 – 2 day breakout below the 3 day consolidation first.
Until there is a strong breakout far above or below the range, the odds are that every 5 – 10 day swing up or down will reverse.
Overnight EURUSD Forex trading
The EURUSD 5 minute Forex chart traded sideways in a 40 pip range overnight This broke above the 4 day tight bear channel. The bulls want a major trend reversal up. Yet, even if they get it, the rally will probably stall about 100 pips above, which is the middle of the 2 month range. Since the 4 day channel was tight, the bears were strong. Therefore, the bulls will probably need more sideways trading before they can generate enough buying pressure for the 2- 5 day rally.
The bears want the bull bottom attempt to fail. They want a double top bear flag and a resumption of the 4 day bear trend. The momentum down over the past week favors a bear breakout. However, the 5 day selloff is near the bottom of a 2 month trading range. Hence, the odds are that a bear breakout on the 5 minute chart will probably only be about 50 – 100 pips before there is a reversal up.
Since the 3 day range has been tight, day traders have been mostly scalping. The bulls are looking to buy reversals up from the bottom of the 3 day range. The bears are looking to sell reversals down from the top. The breakouts have been small and brief. Most day traders will not swing part of their trades until there is a strong breakout up or down.
Summary of today’s S&P Emini futures price action and what to expect tomorrow
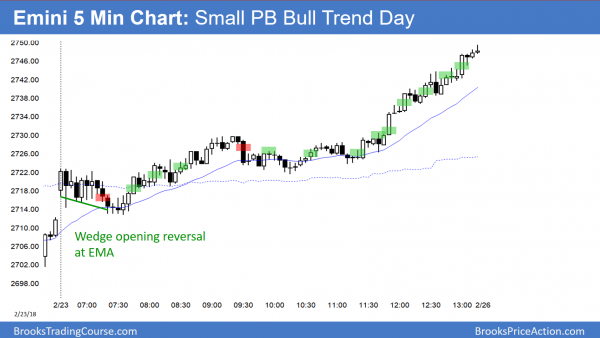
After a weak early rally, the Emini entered a trading range. The bull trend resumed at the end of the day.
The Emini triggered a buy signal on the daily chart by going above yesterday’s high. It was an ioi buy signal. Yet, it could not trigger the buy signal on the weekly chart. However, it probably will do that early next week.
See the weekly update for a discussion of the price action on the weekly candlestick chart and for what to expect going into next week.
Traders can see the end of the day bar-by-bar price action report by signing up for free at BrooksPriceAction.com. I talk about the detailed S&P Emini futures price action real-time throughout the day in the BrooksPriceAction.com trading room. We offer a 2 day free trial.
When I mention time, it is USA Pacific Standard Time (the Emini day session opens at 6:30 am PST, and closes at 1:15 pm PST). You can read background information on the intraday market reports on the Intraday Market Update page.


