Emini in breakout mode, awaiting central bank interest rate decisions
Updated 6:51 a.m.
Yesterday had a small range and therefore there is an increased chance of an outside day today. The Emini reversed up from below yesterday’s low on the open. Yet, because of 2 small trading range days, many traders will wait for more signs of strength or for 2nd entries before taking stop entries. This is because of inertia. This means that the market tends to continue to do what it has been doing, despite strong attempts to change.
At the moment, the Emini is Always In Long. Yet, the bars are small and the Emini has been in a tight range for 2 days. Therefore, this is likely a trading range open. Furthermore, it increases the chances of another trading range day. As always, if there is a strong breakout with good follow-through, traders will conclude that a trend has begun. Without that, it is more likely that that will be both a 2 – 3 hour swing up and down. The Emini is now deciding which will come first.
Pre-Open market analysis
The Emini was in a small trading range yesterday. It now has 4 consecutive trading range bars on the daily chart. Furthermore, it is in the middle of a month long trading range. It is therefore in breakout mode. Hence, it is likely waiting for September central bank announcements.
Even though all higher time frames are in bull trends, the weekly and monthly charts are in buy climaxes. Therefore the odds favor a correction down to the March low before the Emini can go much higher. Yet, until there is a strong breakout up or down, trading range trading will probably continue.
Today is Friday so weekly support and resistance can be magnets at the end of the day. The weekly chart so far is an inside doji bar. Therefore the most important magnet is this week’s open. If the Emini is within 5 points in the final hour, it will probably test it.
Overnight Emini Globex trading
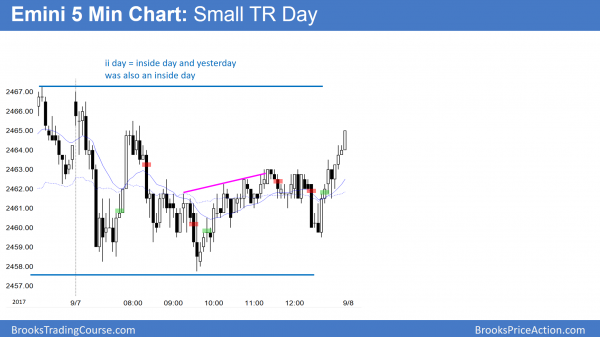
The Emini is down 6 points in the Globex market. It will therefore probably open nears yesterday’s low. Yesterday was the 2nd consecutive inside day and it is therefore an ii pattern, which means that the chart is in breakout mode. However, since yesterday was a doji, it is a weak signal bar. This reduces the chances that a break below yesterday’s low will result in a bear trend. More likely, a breakout above or below yesterday’s range will fail within a day or two.
This is especially true since the daily chart is in the middle of a 3 month trading range. Therefore, most breakout attempts fail, and the trading range just keeps adding bars to the range. Consequently, the odds favor another trading range day, even if today breaks below or above the 2 day Breakout Mode pattern (the ii pattern).
Yesterday’s setups
Here are several reasonable stop entry setups from yesterday. I sometimes also show limit order entries and entries on the close of bars.
EURUSD Forex market trading strategies
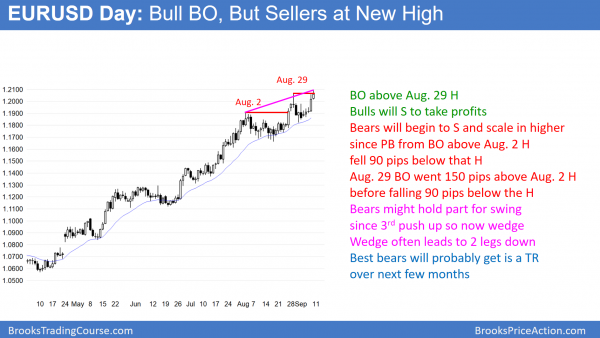
The EURUSD daily chart is in its 3rd push up after the strong July rally. Since the pullback from the August 29 high fell below the August 2 high, this is now a Stairs pattern. Bears will assume that the current breakout will pull back as well.
The daily EURUSD chart broke above the August 29 high. Because bears were able to make money by selling above the August 2 high and scaling in higher, they assume that the bull trend is weakening. They therefore will sell again above the August 29 high and scale in higher. This is because they believe that the strong bull trend will soon evolve into a broad bull trend or a trading range. In either case, bulls take partial profits above prior highs and look to buy pullbacks instead of breakouts.
In addition, bears begin to sell above prior highs for scalps. Since this is the daily chart, the bears will look for 50 – 100 pip scalps. However, since the August 29 high went about 150 pips above the August 2 high, the bears do not want the current breakout to go much more than that above the August 29 high. As long as it does not, they believe that the rally will soon convert into a trading range. This means they therefore think that selling above prior highs for scalps is a profitable strategy.
3rd push up so possible wedge top
The breakout above the August 29 high is the 3rd push up after the strong tight bull channel in July. Traders know that trends eventually weaken and evolve into trading ranges. If bears can begin to make money by selling new highs, traders believe that this is an early sign of a market becoming more 2 sided. Hence, they expect it to continue to weaken and eventually evolve into a trading range. At that point, the bulls and bears are equal. Both will look for a breakout and a measured move based on the height of the range. Since this is a daily chart, the range will have to grow to 20 or more bars before traders conclude that the bars are almost as strong as the bulls.
Once a rally has a 3rd push up, it is a wedge top. Yet, if the wedge bull channel is tight, the odds are that there will not be a significant reversal. However, the pullback from the breakout above the 1st push up was deep enough to make traders believe that this wedge will probably convert into a trading range within the next month or so. The 1st target for the bears is the bottom of the pullback after the 1st push up. That is the August 17 low. If the bears get their target, the market usually bounces and forms a trading range.
Overnight EURUSD Forex trading
While the over night rally broke above the August 29 high, the rally was weak. In addition, the breakout was small. Since the August 29 high was 150 pips above the August 2 high, this current breakout might continue up for another 50 – 150 pips before there is a pullback. Because it is impossible to know how high the rally will go before pulling back, the bears will begin to sell just above the August 29 high. In addition, they will scale in higher. As long as the breakout does not go much more than 150 pips above the August 29 high, traders will assume that there will be a pullback below the August 29 high.
Because of the Stairs pattern on the daily chart, day traders on the 5 minute chart will look for reversal patterns above the August 29 high. They will scalp or swing trade them. Remember, although a 50 – 150 pip short on the daily chart is a scalp on that time frame, it is a swing trade on the 5 minute chart.
The bulls will look to buy pullbacks from reversals down on the daily chart. This is because the August 29 high went 150 pips above the August 2 high. Therefore day trading bulls will bet that they an get swing trades of 50 pips or more on the 5 minute chart.
Because the daily chart is becoming more 2 sided, there will be more trading range days. Consequently, day traders will probably have lots of opportunities to scalp for 10 – 20 pips up and down.
Summary of today’s S&P Emini futures price action and what to expect tomorrow
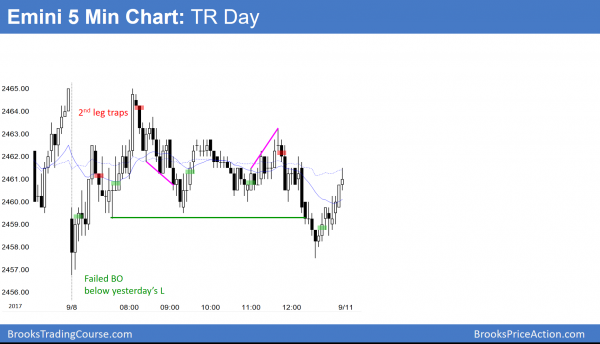
Today was the 3rd consecutive small trading range day. While the Emini reversed up from below yesterday’s low, it could not get above yesterday’s high.
Today was the 3rd consecutive small trading range day. In addition, it is in the middle of a 3 month trading range. Therefore the Emini is in breakout mode. There is no evidence yet of the direction of the breakout.
See the weekly update for a discussion of the price action on the weekly candlestick chart and for what to expect going into next week.
Traders can see the end of the day bar-by-bar price action report by signing up for free at BrooksPriceAction.com. I talk about the detailed S&P Emini futures price action real-time throughout the day in the BrooksPriceAction.com trading room. We offer a 2 day free trial.
When I mention time, it is USA Pacific Standard Time (the Emini day session opens at 6:30 am PST, and closes at 1:15 pm PST). You can read background information on the intraday market reports on the Intraday Market Update page.


