Trading Update: Tuesday August 2, 2022
Emini pre-open market analysis
Emini daily chart
- The Emini has had a 5-bar bull micro channel with four consecutive bull bars. The odds are beginning to favor at least a minor pullback soon, with Emini first reversal down likely to fail.
- The odds also favor a test of the June 2nd high regardless of a pullback first.
- The bull breakout up to July 29 is strong enough for a second leg up, which means traders will buy the first attempt down expecting it to only lead to a brief selloff that will soon have higher prices.
- Bears want the Emini to form a double top with June 2nd and lead to a bear breakout below the neckline (June 17), leading to a measured move down of around 500 points. There is only a 20% chance of this at the moment. How do we know it is 20% and not 30%? We do not; the point is that the odds of it happening are very low, and more likely, if the market does fall below the June 17 low, bulls will buy and reverse the market up.
- The bulls want the opposite of the bears and see June 2nd as a neckline of a double bottom (June 17). They want a breakout above the neckline and a measured move up 500 points to around 4,600 (March high).
- At the moment, the odds favor the measured move up to 4,600 before the bears get a 500-point measured move down below June 17,
- The market does not have to get a measured move up or down for a long time; the odds favor the market going sideways here. That means even if the market breaks above the June 2nd high, it probably will not rally that far before the trading range price action continues.
- Notice how the close of August 1st is in the middle of the tight trading range of May 27 – June 8. This is a reminder that the market saw this as a fair price, and the market is currently deciding if traders are happy with this price.
- Overall, the bulls have done an excellent job over the past four trading days, but they need to do more. The bulls need to show traders their strength by breaking far above the June 2nd high, which would make traders wonder if the market will get the 500-point rally and breakout above the June 2nd neckline of the double bottom (June 17).
- More likely, the market will begin to go sideways soon.
Emini 5-minute chart and what to expect today
- Emini is down 22 points in the overnight Globex session.
- Market has sold off in a bear channel during the overnight Globex session.
- The odds favor a pullback on the daily chart, so traders should not be surprised if today has a close below the open.
- Traders should also pay attention to the open of the day. Since today is likely to have a bear close, if the market is above the open (but not far above it) late in the day, sellers may come in and drive the market down to below the open.
- Today is likely to have more trading range price action, which means traders should expect reversals.
- If today is similar to yesterday, and the market has a rally lasting around 40 bars, traders should look for signs of a potential midday reversal.
- Traders should expect a limit order open and wait for strong consecutive trend bars (similar to yesterday) before looking to enter in the breakout direction.
- As always, traders may want to consider waiting for 6-12 bars before placing a trade. This is because the market will likely go sideways during the first hour.
- Lastly, traders should not be hopeful. If the market is going sideways, do not be eager to enter the first sign of a breakout. If the market has a strong breakout, there will be plenty of opportunities to buy.
- It is easy on the open to get trapped, taking one or two breakouts and ending up with a couple of big losses, which one will spend the rest of the day trying to get back to breakeven.
Yesterday’s Emini setups

Al created the SP500 Emini charts.
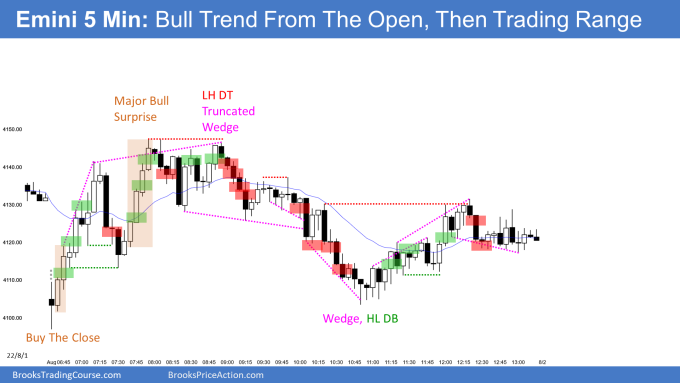
Above are several reasonable stop entry setups from yesterday. I show each buy entry with a green rectangle and each sell entry with a red rectangle. Buyers of both the Brooks Trading Course and Encyclopedia of Chart Patterns have access to a much more detailed explanation of the swing trades for each day (see Online Course/BTC Daily Setups).
My goal with these charts is to present an Always In perspective. If a trader was trying to be Always In or nearly Always In a position all day, and he was not currently in the market, these entries would be logical times for him to enter. These therefore are swing entries.
It is important to understand that most swing setups do not lead to swing trades. As soon as traders are disappointed, many exit. Those who exit prefer to get out with a small profit (scalp), but often have to exit with a small loss.
If the risk is too big for your account, you should wait for trades with less risk or trade an alternative market like the Micro Emini.

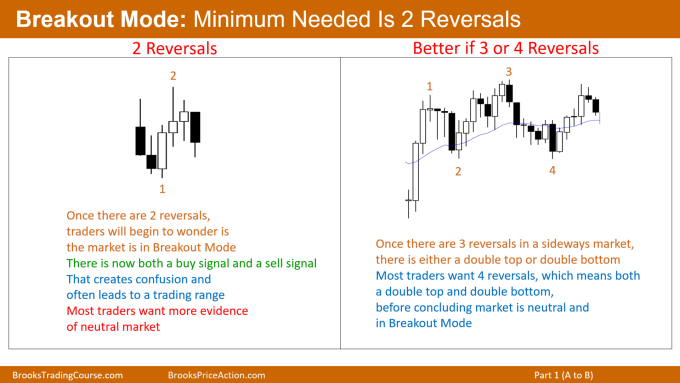
today I am including a sample general information slide from the Encyclopedia above.
EURUSD Forex market trading strategies
EURUSD Forex daily chart

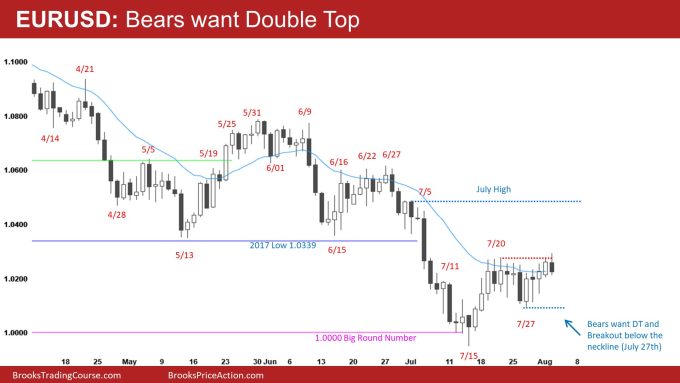
- The bears are trying to get a DT and failed breakout above the July 21st high.
- They hope today will lead to a credible stop entry short, a breakout below the neckline (July 27th), and a measured move down below the July 14 low.
- The market is in the middle of two important price levels, 1.0000 big round number and the 2017 low.
- At the moment, the odds are close to 50% on which price level gets tested first.
- Ultimately, the market will return to the 2017 low, which is also the bottom of the May – June trading range. Even if the market reaches the 1.0000 big round number first, the market will likely form a double bottom and test back up the 2017 low.
- It would be better for the bulls if the market does test a low close to the 1.0000 big round number and form a double bottom with the July 14 low. That would create a more credible major trend reversal and increase the odds of the bulls being able to breakout above the neckline (August 2nd) and going up for a measured move up to the June 27th high.
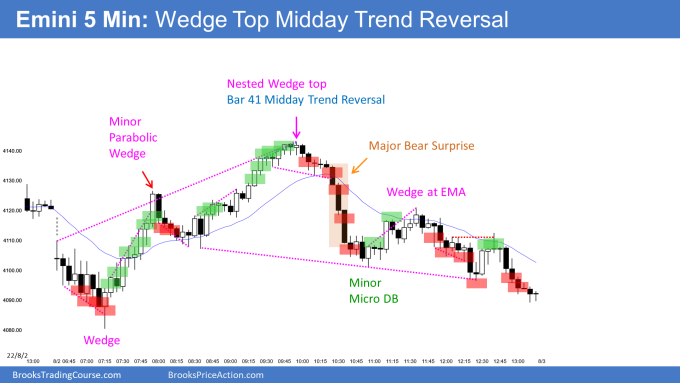
Summary of today’s S&P Emini futures price action and what to expect tomorrow

Al created the SP500 Emini charts.
End of day video summary
See the weekly update for a discussion of the price action on the weekly chart and for what to expect going into next week.
Trading Room
Traders can see the end of the day bar-by-bar price action report by signing up for free at BrooksPriceAction.com. Al talks about the detailed S&P Emini futures price action real-time throughout the day in the BrooksPriceAction.com on trading room days. We offer a 2 day free trial.
Charts use Pacific Time
When times are mentioned, it is USA Pacific Time. The Emini day session charts begin at 6:30 am PT and end at 1:15 pm PT which is 15 minutes after the NYSE closes. You can read background information on the market reports on the Market Update page.

