Trading Update: Wednesday September 20, 2023
S&P Emini pre-open market analysis
Emini daily chart
- The market failed to breakout below the September 7th low yesterday, allowing limit order bulls to make money below the September 7th low.
- The bears tried to get a second leg down after last Friday’s bear breakout bar.
- However, because of Monday’s bad follow-through bar, most bears scalped out yesterday, resulting in a reversal bar. The bulls want a reversal up in the upcoming days.
- With the limit order bulls making money below the September 7th low and the bears scalping out, this is a reminder that the daily chart is in a trading range.
- The Bulls are hopeful that yesterday is the start of a reversal up and test of the September 1st high.
- Because yesterday’s buy signal bar is a bear reversal bar, that will increase the odds of a sideways rather than a strong upside breakout today.
- If the bulls are lucky, today will be a strong bull reversal bar, which would trap the bears into a bad short and trap the bulls out of a good buy.
- Overall, traders should be neutral on the daily chart. The 20, 50, and 100 period moving averages are flat and near the current price level. This is a sign that the market is neutral.
Emini 5-minute chart and what to expect today
- Emini is up 17 points in the overnight Globex session.
- The market will likely gap up on the open of the U.S. Session.
- Traders should expect at least an 80% chance of a trading range open and a 20% chance of a trend from the open.
- Most traders should wait 6-12 bars before placing a trade.
- Today is an FOMC day, which means traders should be flat at least 30 minutes before the 2 PM ET report.
- Traders should wait at least 10 minutes after the release of the FOMC report before trading again. Getting a big bar during the FOMC release and a sudden reversal bar on the next bar is common.
- Traders should also treat the FOMC release as the start of a new session. This means the prior bars leading to the report will be less important.
- If a trader is going to trade the FOMC report, they should trade 20% of their normal position size.
- Lastly, traders can also consider only trading half of the day. FOMC reports can lead to sudden reversals, which traps traders.
- There is a higher probability of low-probability events during the FOMC. There is nothing wrong with taking the rest of the day off 30 before the FOMC release.
- A trader’s goal is to make money, not trade all the time. Sometimes, to make money, it is best to step aside.
Emini intraday market update
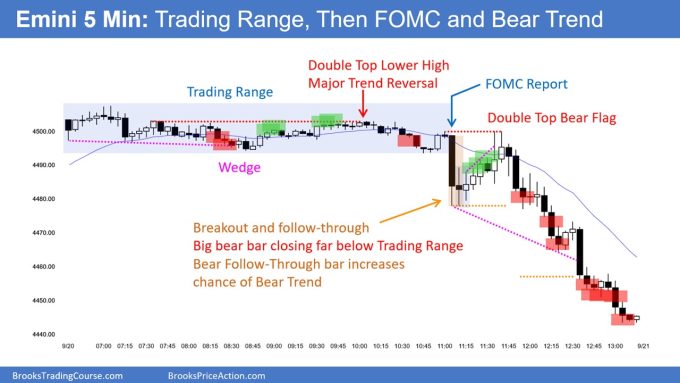
- The Emini has been in a tight trading range for the first 3 hours of the session and will probably continue to go sideways up until the release of the report.
- Most traders will be better off halting any trading until 10 minutes after the FOMC report has been released.
- As mentioned above, traders must be ready for anything when the report gets released at 2:00 PM EST. However, they should expect disappointment.
- Lastly, traders should trade 20% of their normal position size once the FOMC report gets released. Often, the bars can get very big after the report, so it is better to trade smaller than one thinks they should trade.
- Lastly, there is nothing wrong with waiting until tomorrow and not trading the FOMC report.
Yesterday’s Emini setups

Al created the SP500 Emini charts.
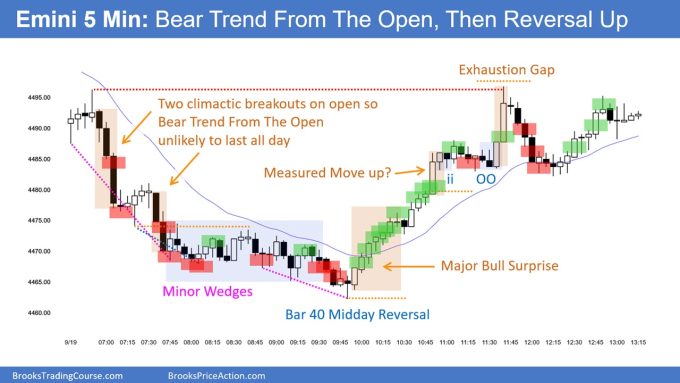
Here are several reasonable stop entry setups from yesterday. I show each buy entry with a green rectangle and each sell entry with a red rectangle. Buyers of both the Brooks Trading Course and Encyclopedia of Chart Patterns have access to a near 4-year library of more detailed explanations of swing trade setups (see Online Course/BTC Daily Setups). Encyclopedia members get current daily charts added to Encyclopedia.
My goal with these charts is to present an Always In perspective. If a trader was trying to be Always In or nearly Always In a position all day, and he was not currently in the market, these entries would be logical times for him to enter. These therefore are swing entries.
It is important to understand that most swing setups do not lead to swing trades. As soon as traders are disappointed, many exit. Those who exit prefer to get out with a small profit (scalp), but often have to exit with a small loss.
If the risk is too big for your account, you should wait for trades with less risk or trade an alternative market like the Micro Emini.
EURUSD Forex market trading strategies
EURUSD Forex daily chart

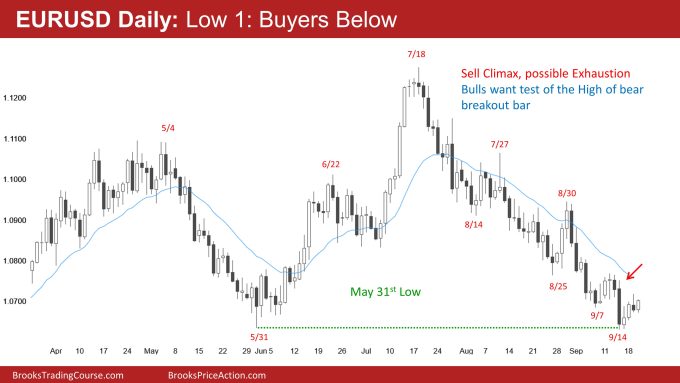
- The EURUSD formed a Low 1 sell setup yesterday. However, there are likely buyers below.
- Most Low 1 sell setups have buyers below, which leads to deeper pullbacks. This is because the context for the Low 1 short is often bad, leading to buying below the Low 1.
- The context of the EURUSD favors higher prices and a test of the September 14th high after the consecutive sell climaxes down to the May 31st low.
- It was reasonable for the Always In Bear to exit above the September 18th high due to the probability of seeing a two-legged rally to the moving average.
- If a bear got out above the September 18th high, it likely would not sell again below the Low 1 on the very next bar.
- The bears want today to be a strong entry bar below yesterday’s Low 1. This would potentially trap the bulls who bought below the Low 1 and trap the bears out of a potentially good trade. The bulls who buy below the Low 1 will probably make money and not get trapped.
Summary of today’s S&P Emini price action

Al created the SP500 Emini charts.
End of day video review
Live stream videos to follow Monday, Wednesday and Friday (subject to change).
See the weekly update for a discussion of the price action on the weekly chart and for what to expect going into next week.
Trading Room
Al Brooks and other presenters talk about the detailed Emini price action real-time each day in the BrooksPriceAction.com trading room days. We offer a 2 day free trial.
Charts use Pacific Time
When times are mentioned, it is USA Pacific Time. The Emini day session charts begin at 6:30 am PT and end at 1:15 pm PT which is 15 minutes after the NYSE closes. You can read background information on the market reports on the Market Update page.

