Emini end of quarter window dressing, but buy climax
Updated 6:54 a.m.
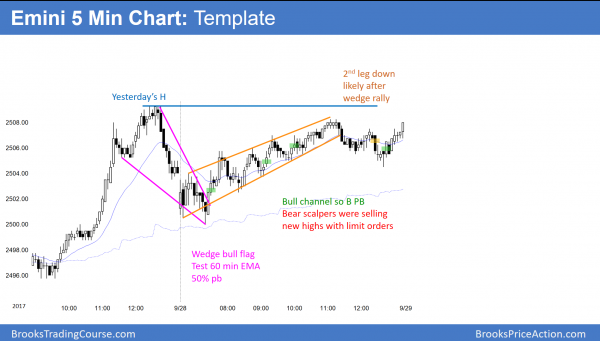
The 2nd bar was a strong bear reversal bar that formed a double top with Wednesday’s all-time high, In addition, yesterday’s rally was weak and therefore probably a bull leg in what will become a trading range. The Emini is now trying to find the top of the range. The bulls want yesterday’s bull channel to have a strong bull breakout. They have only a 25% chance of success.
By trading above yesterday’s high, the Emini triggered a buy signal on the daily chart. Yet the breakout bar was a big bear reversal bar. This is therefore disappointing for the bulls. Consequently, it reduces the chances of a big bull trend day. The weak channel from yesterday also makes a strong bull day unlikely.
The Emini reversed down from yesterday’s high, and it had a 2nd signal. This is a higher probability sell, and it increases the chance that this is the high of the day. However, the Emini bounced strongly after a brief selloff. This increases the chance of a continuation of yesterday’s 4 hour trading range. However, the selloff and context now make a bull trend day unlikely. Therefore today will probably be a trading range day, or possibly a weak bear trend day.
Pre-Open market analysis
The Emini formed a bull inside day yesterday in its bull trend. It is therefore a buy signal bar for today. Yet, the monthly chart is extremely overbought. As a result, the odds are that there are sellers above yesterday’s high and Wednesday’s all time high. Consequently, the odds are against a strong bull trend day.
In addition, yesterday’s rally was weak. It was therefore probably part of a trading range after Wednesday’s strong rally. This further increases the odds of another mostly trading range day today.
Overnight Emini Globex trading
The Emini is down 2 points in the Globex market. In addition, it traded in a very tight range overnight. Since yesterday is a buy signal bar on the daily chart, the odds are that the Emini will rally above yesterday’s high today or early next week. However, it is also at the top of a 2 week tight trading range. Consequently, the bull breakout will probably fail to get far.
Since yesterday was a bull trend day on the daily chart, it is a weak sell signal bar. As a result, the odds are that there are probably buyers below its low. Because there are probably buyers below yesterday’s low and sellers above, the odds favor a mostly trading range day today.
Today is the last day of the week and of the month. Therefore the Emini might test weekly support or resistance, especially in the final hour. This means that if it is within 3 points or so of support or resistance in the final hour, it will probably get drawn to that magnet. Important targets are last week’s high and low, this week’s open, and last month’s high.
Yesterday’s setups
Here are several reasonable stop entry setups from yesterday. I sometimes also show limit order entries and entries on the close of bars.
EURUSD Forex market trading strategies
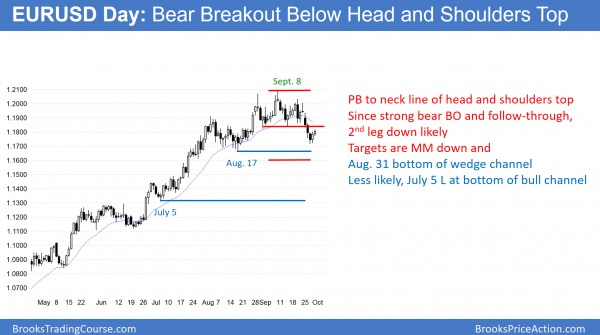
The EURUSD daily Forex chart had 3 strong bear days breaking below the neck line of a head and shoulders top. The bulls are buying just above the August 17 major higher low. They therefore want a double bottom higher low and a resumption of the bull trend. Yet, the breakout was strong. Therefore, the odds favor a 2nd leg down, even if the pullback goes above the September 14 low and is over 100 pips tall.
The 3 day break below the neck line of the head and shoulders top was strong. Therefore the 2 day reversal up from a higher low double bottom with the August 17 low will probably fail. This is true even if it continues up for a few more days, goes above the September 14 breakout point, and is over 100 pips tall.
Unless the bulls break strongly above the September 20 major lower high, the odds favor at least one more leg sideways to down. At the moment, the odds favor a break below the August 17 major higher low. Yet, a head and shoulders topi s a trading range. A continued trading range is more likely than a bear trend. This is especially true when the top is small. It is therefore likely minor. This means that a trading range is more likely than a bear trend.
Weekly chart in strong bull trend
The weekly chart is in a tight bull channel, which means a strong bull trend. Consequently, the odds are that the current selloff is simply a sideways to down pullback to the 20 week exponential moving average. If the selloff continues down to the August 17 low, it will be at the average. It will also be a test of the May 3, 2016 top of a 2 year trading range. That support is around 1.1600.
It will therefore create a 20 bar moving average gap bar buy setup. There is a gap below this week’s low and the EMA. There have been gaps below bars for over 20 weeks. This means that the bulls have been so eager to buy that they have been buying above an average price. When that happens, they are usually very happy to finally buy at the average price. As a result, the current selloff will probably end around that support.
This does not mean that the bull trend will resume at that point. However, the weekly chart will probably rally for at least several weeks. The result will then either be a trading range or a resumption of the bull trend. Less likely, the selloff will continue down to the July 5 start of the bull channel. That is around 1.1300.
Overnight EURUSD Forex trading
Yesterday’s bull reversal continued up overnight. The minimum target is the September 15 low of 1.1837, which is within 10 pips of the current price. While the 2 day rally might fail below that point, the odds are that it will continue at least a little above. This is because the daily chart has been in a trading range for 2 months. Trading ranges constantly disappoint bulls and bears. The easiest way to disappoint the bears is to rally back above the neck line of the head and shoulders top.
The next resistance above that is the 50% pullback. That is around the September 20 low of 1.1860. The final resistance is the top of the right shoulder of the head and shoulders top. That is the September high of 1.2033.
Most likely, the rally will last a few more days and go just above the September 20 low. Therefore, day traders will look to buy pullbacks until the rally is above resistance. The bears want the rally to stall for many hours before they will sell for a swing down. Until then, they will only scalp.
Summary of today’s S&P Emini futures price action and what to expect tomorrow
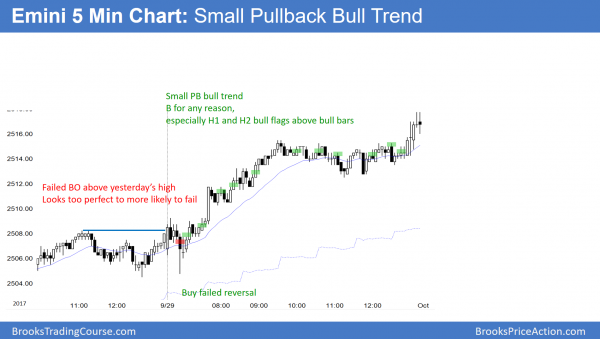
The Emini broke to a new all-time high and rallied in a spike and channel bull trend. It spend most of the rest of the day in a tight trading range.
The Emini broke strongly above yesterday’s high and rallied in a spike and channel bull trend to a new all-time high. It traded in a tight range for most of the rest of the day, and had minor trend resumption up into the close. Since the rally was not strong, the channel will likely lead to a day or two of sideways trading early next week. Yet, the 2 day rally was strong enough to make at least a small 2nd up likely after the 1st pullback.
Monday is the 1st day of the month. Therefore, the monthly chart will decide to resume up or reverse down after the strong rally in September. After a big bull month, there is an increased chance of an inside month or even a bear month. Also, October is the 12th month is a monthly micro channel. the odds are that there will be a pullback within a month or two.
See the weekly update for a discussion of the price action on the weekly candlestick chart and for what to expect going into next week.
Traders can see the end of the day bar-by-bar price action report by signing up for free at BrooksPriceAction.com. I talk about the detailed S&P Emini futures price action real-time throughout the day in the BrooksPriceAction.com trading room. We offer a 2 day free trial.
When I mention time, it is USA Pacific Standard Time (the Emini day session opens at 6:30 am PST, and closes at 1:15 pm PST). You can read background information on the intraday market reports on the Intraday Market Update page.


