Trading Update: Wednesday February 23, 2022
Emini pre-open market analysis
Emini daily chart
- Yesterday was a weak reversal up from a double bottom higher low major trend reversal with January 28 low.
- If the bulls get consecutive bull bars closing above the February 9 high, they would then likely get a break above the January high before a break below the January low.
- If this week reverses up, it is more likely that this will be another minor reversal in the 7-month trading range.
- Traders will look for a reversal down from below the February 9 high or from a double top with that high.
- There would then be a head and shoulders top bear flag where the January 26 high is the left shoulder and the February 9 high is the right shoulder.
- The odds still favor a break below the January low before a break above the January high because of the back-to-back OO (consecutive outside bars) on the monthly chart.
- Since yesterday was a bear doji bar, it is a weak buy signal bar for today. That reduces the chance of a strong rally over the next several days. There may be more sellers than buyers above yesterday’s high.
- However, because yesterday reversed up from the important support of the January 28 low, there might be some follow-through buying today or tomorrow.
Emini 5-minute chart and what to expect today
- Emini is up 20 points in the overnight Globex session.
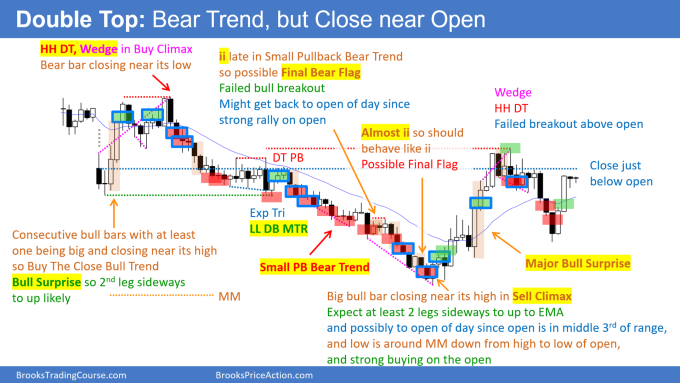
- Yesterday’s late rally from the January 28 low was a Major Bull Surprise on the 5-minute chart. That means it was strong enough to affect the next several days. It increases the chance of sideways to up trading today and tomorrow.
- But with the close in the middle of the day’s range, the bulls will buy early consecutive big bull bars closing near their highs if the follow-through is going to be up instead of sideways.
- The bears are hoping yesterday was just a pause at support. They would like the 2-week bear trend to resume today, but the odds favor at least a couple hours of follow-through buying in the 1st half of today.
- If the bear trend is going to resume today, the bears will have a better chance later in the day. That means that any early selling today will more likely be a bear leg in a trading range than the start of a bear trend.
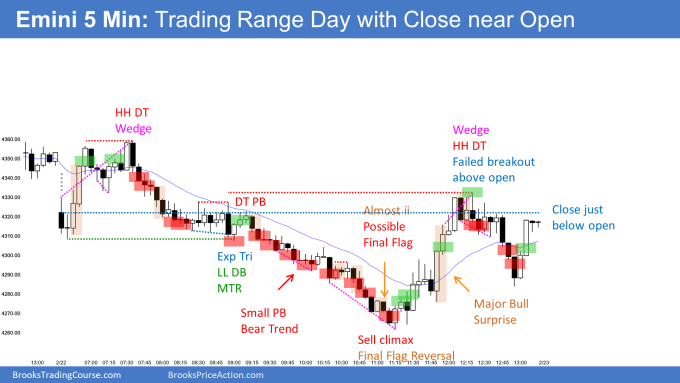
Yesterday’s Emini setups


Here are several reasonable stop entry setups from yesterday. I show each buy entry with a green rectangle and each sell entry with a red rectangle. Buyers of both the Brooks Trading Course and Encyclopedia of Chart Patterns have access to a much more detailed explanation of the swing trades for each day (see Online Course/BTC Daily Setups).
My goal with these charts is to present an Always In perspective. If a trader was trying to be Always In or nearly Always In a position all day, and he was not currently in the market, these entries would be logical times for him to enter. These therefore are swing entries.
It is important to understand that most swing setups do not lead to swing trades. As soon as traders are disappointed, many exit. Those who exit prefer to get out with a small profit (scalp), but often have to exit with a small loss.
If the risk is too big for your account, you should wait for trades with less risk or trade an alternative market like the Micro Emini.
EURUSD Forex market trading strategies
EURUSD Forex daily chart

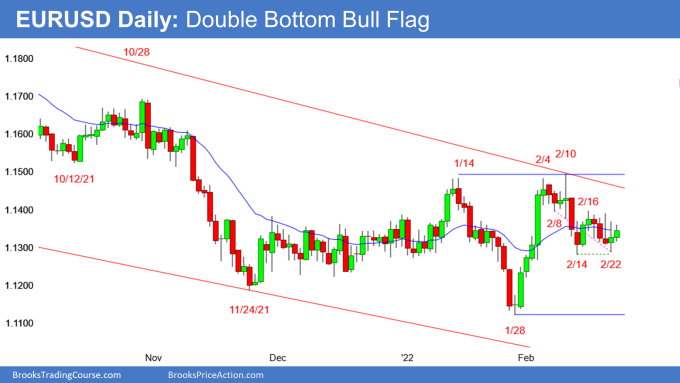
- Double bottom higher low major trend reversal.
- Double bottom bull flag with February 22 low and truncated wedge bull flag with February 8 and 14 lows
- Yesterday was only a bull doji and it is therefore a low probability buy signal bar.
- 3-week selloff lacks consecutive big bear bars closing near their lows. More likely bull flag than bear trend.
- Traders should expect at least a couple months of sideways to up trading, and the January low is probably the start. However, the EURUSD has been sideways for a couple weeks and it might trade more sideways to down before the bulls get a 2nd leg up from the February 2 rally.
- The EURUSD has been in a trading range for 4 months. It is therefore in Breakout Mode.
- But the yearlong bear trend lasted a long time, given that it was within an 8-year trading range. It is still probably only a pullback from the 2020 rally. Also, the January 28 low is a test of support at the June 26 low. Finally, the February 2 rally was strong. These factors give the bulls a 60% chance of a 2nd leg up.
- However, a couple big bear bars closing near their lows will make a break below the January low more likely.
Summary of today’s S&P Emini futures price action and what to expect tomorrow

End of day summary
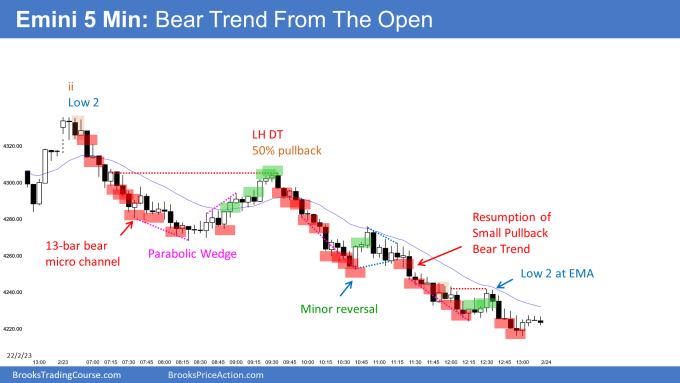
- Today gapped above yesterday’s close, but reversed down from an ii and a Low 2 top.
- The day began as a Bear Trend From The Open.
- The bulls got a big minor reversal up after a parabolic wedge.
- The rally reversed down from a 50% retracement of the selloff on the open. This was a failed attempt at a bull trend reversal.
- It sold off for the rest of the day in a Small Pullback Bear Trend.
- I have been saying all month that the Emini would break below the January low before breaking above the January high because of the back-to-back OO patterns on the monthly chart. Today got to within a few points.
- The Emini might break below it tomorrow, and it might even gap down below it.
- That low is the neckline of a head and shoulders top on the daily chart (November 22 is the left shoulder and February 2 is the right shoulder).
- The bulls hope for a sharp reversal up tomorrow, which would be from a double bottom with the January low.
- The bears want a strong break below that low and then a measured move down to around the pre-pandemic high.
- I have been saying that this selloff probably would continue down to below the 4,000 Big Round Number. There is a gap below the April 2021 low on the monthly chart that is also a magnet.
- There is currently only a 30% chance that the selloff will reach the February 2020 pre-pandemic high.
See the weekly update for a discussion of the price action on the weekly chart and for what to expect going into next week.
Trading Room
Traders can see the end of the day bar-by-bar price action report by signing up for free at BrooksPriceAction.com. I talk about the detailed S&P Emini futures price action real-time throughout the day in the BrooksPriceAction.com on trading room days. We offer a 2 day free trial.
Charts use Pacific Time
When I mention time, it is USA Pacific Time. The Emini day session charts begin at 6:30 am PT and end at 1:15 pm PT which is 15 minutes after the NYSE closes. You can read background information on the market reports on the Market Update page.

