Emini buy the rumor, sell the fact after tax cut vote?
Updated 6:50 a.m.
The Emini gapped above the 2 day bull flag but immediately sold off with big bear bars. There is only a 20% chance of a bull trend day. Today will be either a bear trend day or a reversal day. If it reverses up for the remainder of the day, it will probably not be above to get much above the open. The result would be a doji day on the daily chart, which is a trading range day.
The bears want to close the gap below Monday’s low. In addition, they want this early selloff to be a spike down in an Spike and Channel bear trend day. The early selloff was extreme and therefore climactic. Consequently, there will probably be a reversal up soon. If the reversal up is strong, it could last all day and test back up to the high. If it is weak. traders will sell it and look for a swing down. The next 5 – 10 bars should tell traders if today will be a bear trend day or a trading range day.
Pre-Open market analysis
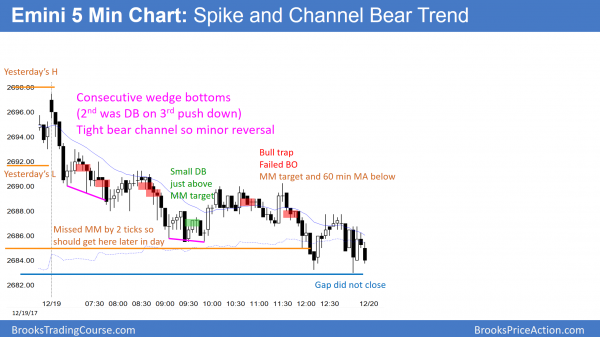
Yesterday sold off in a spike and channel bear trend. While it got close to Friday’s high, it did not close the gap. The bears hope that the reversal down on the daily chart is a wedge top reversal with the December 4 and 17 highs. If they get a gap down on any day in the next couple of weeks, they would have an island top. If the Emini sells off below Friday’s high, Monday’s gap up would be an exhaustion gap. Either event would slightly increase the chance for a 2 legged or bigger correction.
Because the tax cut vote is important, it increases the chance of a big move up or down. Furthermore, if Congress allows the government to shut down this month, the Emini will sell off. Finally, there is still a chance for profit taking going into the end of the year. The bears need consecutive very big bear bars to convince traders that any selloff is more than a pullback. Without that, the odds still favor higher prices.
Overnight Emini Globex trading
The Emini is up 8 points in the Globex market. The 2 day selloff was a wedge bull flag after Monday’s gap up. Today will probably gap above the 2 day bear channel, and the bulls will then try to break to a new all-time high.
Because the congressional vote to keep the government open is very important and it is coming up within a week, the Emini might become neutral before the vote. In addition, traders, institutions, and governments are distracted by the holidays. This tends to create smaller ranges and fewer breakouts. Consequently, most of the trading until January will probably be sideways with occasional brief breakouts. If the government shuts down, there will be at least a couple of weeks of selling.
Yesterday’s setups
Here are several reasonable stop entry setups from yesterday. I sometimes also show limit order entries and entries on the close of bars.
EURUSD Forex market trading strategies
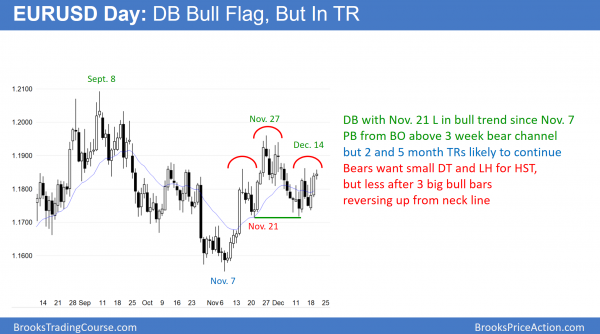
The EURUSD daily Forex charts is in nested trading ranges and therefore in breakout mode. The last clarity was the November rally, and therefore the odds slightly favor the bulls.
The EURUSD daily Forex chart is in a 3 week trading range that is in a 2 month trading range. That is in a 5 month trading range withing a 2 year range. It is therefore in breakout mode. The last clear strength on the daily chart was the November rally. Consequently, the odds are slightly higher for a test of the November 27 top of the 2 month range than for a strong break below the neck line of the head and shoulders top. However, there is no evidence that the daily chart is about to break out up or down. Traders are buying every 1 – 3 day selloff and selling every 1 – 3 day rally. They are also taking quick profits. The result is a trading range.
Traders, institutions, and governments are distracted by the holidays until January. This reduces the odds of big moves until then. However, the U.S. continuing budget resolution vote within the next week is a major catalyst. If the U.S. shuts the government down at some point over the next week, even if briefly, the dollar will probably fall for at least a couple of weeks. That would result in a break above the December 14 high and possibly above the November 27 high.
Overnight EURUSD Forex trading
The 5 minute chart has been in a 30 pip range overnight. The 2 day rally is testing the top of the 3 week trading range. Since the rally lacks momentum, day traders are scalping. They are waiting for a strong breakout up or down before they will swing trade on the 5 minute chart.
Summary of today’s S&P Emini futures price action and what to expect tomorrow
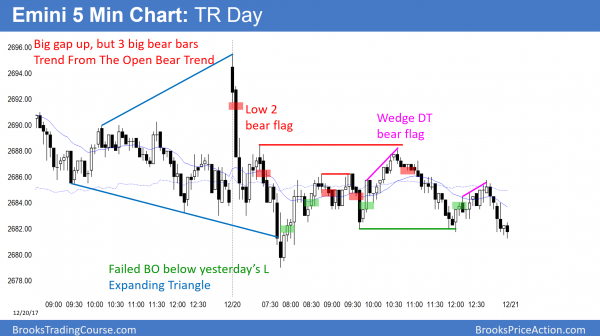
The Emini began with a trend from the open bear trend.
After reversing up from an Expanding Triangle, the bears got trend resumption down from a big double top bear flag. The day was a trading range day.
The Emini pulled back from Monday’s rally for the 3rd day. It closed the gap above Friday’s high, which means the gap is now an exhaustion gap. That does not mean the start of a bear trend. However, it is a sign that the bulls were not as strong this week as they could have been.
Because of the extreme buy climaxes on the daily, weekly, and monthly charts, the odds favor about a 5% pullback beginning in the next few months. Yet, the bears need a strong reversal down, which they have not yet been able to create. Until they do, the odds are that every one of these many reversal will lead to higher prices.
See the weekly update for a discussion of the price action on the weekly candlestick chart and for what to expect going into next week.
Traders can see the end of the day bar-by-bar price action report by signing up for free at BrooksPriceAction.com. I talk about the detailed S&P Emini futures price action real-time throughout the day in the BrooksPriceAction.com trading room. We offer a 2 day free trial.
When I mention time, it is USA Pacific Standard Time (the Emini day session opens at 6:30 am PST, and closes at 1:15 pm PST). You can read background information on the intraday market reports on the Intraday Market Update page.


