Trading Update: Friday March 18, 2022
Emini pre-open market analysis
Emini daily chart
- The bulls have three consecutive bull bars on the daily chart. This increases the odds of a second leg up and a test of the top of the wedge (February 9). Emini bulls want breakout above March 3.
- The bulls hope that this is the start of an all-time high test.
- The bulls are probably always-in long but may need one more bar.
- Since the odds are the bulls will get a second leg up, traders will pay attention to how deep the pullback is. The big question is will the bulls be quick to take profits after a second leg up, or will the bulls continue to get strong closes increasing the odds of higher prices.
- The bears hope that this rally will lead to a second leg trap and some kind of double top. Next, the bears would expect a strong bear breakout leading to a test of the February low.
- While the bulls look like they are taking control, they still need to break above the March 3 lower high and preferably get a strong close above it.
- Today is Friday, so weekly support and resistance will become more important, especially in the second half of the day.
- So far, the bulls have a strong close on the weekly chart. The bulls will try hard to keep the market at this current price level, and the bears will try hard to create as big of a tail as they can today.
Emini 5-minute chart and what to expect today
- Emini is down 25 points in the overnight Globex session.
- The market has been in a trading range for the Globex session.
- Traders should expect today to be mostly a trading range day, especially after the bulls got three consecutive bull trend days.
- If the market opens sideways for 1-5 bars, traders should assume the trading range will last a while and trade it with limit orders (if comfortable with wide stops and scaling in), or traders should wait for a breakout with follow-through.
Yesterday’s Emini setups

Al created the SP500 Emini charts.
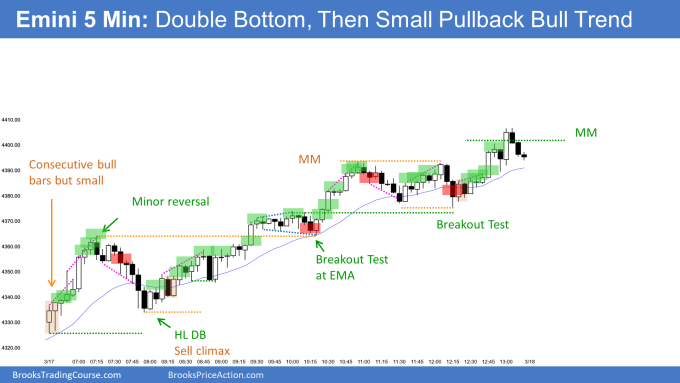
Here are several reasonable stop entry setups from yesterday. I show each buy entry with a green rectangle and each sell entry with a red rectangle. Buyers of both the Brooks Trading Course and Encyclopedia of Chart Patterns have access to a much more detailed explanation of the swing trades for each day (see Online Course/BTC Daily Setups).
My goal with these charts is to present an Always In perspective. If a trader was trying to be Always In or nearly Always In a position all day, and he was not currently in the market, these entries would be logical times for him to enter. These therefore are swing entries.
It is important to understand that most swing setups do not lead to swing trades. As soon as traders are disappointed, many exit. Those who exit prefer to get out with a small profit (scalp), but often have to exit with a small loss.
If the risk is too big for your account, you should wait for trades with less risk or trade an alternative market like the Micro Emini.
EURUSD Forex market trading strategies
EURUSD Forex daily chart

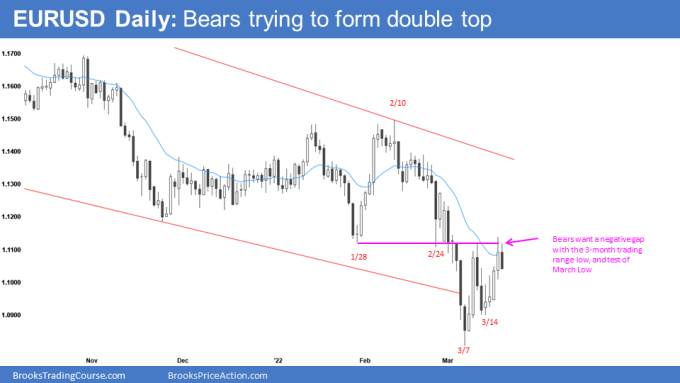
- The bears are trying hard to disappoint the bulls. So far, the bears have a second entry short (which is a double top) after a test of the 3-month trading range low.
- Today’s potential second entry short is following four consecutive bull bars, which lowers the probability for the bears; however, if today is a bear bar closing on its low, it will be a credible short.
- The bears hope this will lead to a test of the March low and possibly a bear breakout below the March range and a test of the 2020 price area. Traders should assume that if today closes on its low, the bears will have at least a 40% chance of testing the bottom half of the March range.
- If the market sells off, the bulls will hope that this will lead to a test of the March 14 higher low and form a double bottom higher low major trend reversal. This would be a more credible buy setup and increase the chances of testing back into the 3-month trading range.
Summary of today’s S&P Emini futures price action and what to expect tomorrow

Al created the SP500 Emini charts.
End of day summary
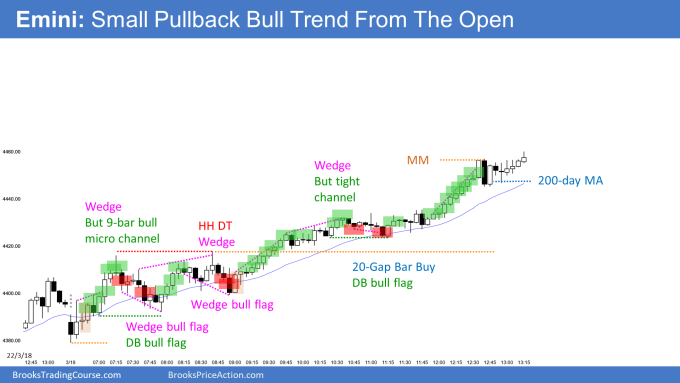
- The bulls had a trend from the open bull trend and a 9-bar bull micro channel.
- The rally up to 7:15 PT tested yesterday’s close and reversed down from a wedge top. The channel up was tight enough, so any selloff was likely to lead to a miner reversal
- The selloff down to 8:00 PT led to a wedge bottom with a high low major trend reversal. You can also call it a head and shoulders bottom with yesterday.
- The market rallied up for two legs around 8:30 and failed twice to break above the high of the day. At this point, the market was clearly in a trading range and breakout mode.
- Around 9:30 PT, the odds were the market was always in long and likely going higher.
- Overall, one can divide the day into two parts. The first 2.5 hours of the day was a trading range day. The rest of the day was a small pullback bull trend.
- After the 9:45 bull breakout, traders were buying every pullback, which led to an upside breakout into the close.
- Today was Friday, which means traders will pay more attention to the weekly chart’s close, especially within the final hour of the day.
- Today was also the third Friday of the month which means there was an increase in volume due to monthly options expiring today. This also increased the chances of a big move happening late in the day.
See the weekly update for a discussion of the price action on the weekly chart and for what to expect going into next week.
Trading Room
Traders can see the end of the day bar-by-bar price action report by signing up for free at BrooksPriceAction.com. I talk about the detailed S&P Emini futures price action real-time throughout the day in the BrooksPriceAction.com on trading room days. We offer a 2 day free trial.
Charts use Pacific Time
When I mention time, it is USA Pacific Time. The Emini day session charts begin at 6:30 am PT and end at 1:15 pm PT which is 15 minutes after the NYSE closes. You can read background information on the market reports on the Market Update page.

