Trading Update: Tuesday July 19, 2022
Emini pre-open market analysis
Emini daily chart
- The market had a big outside down bar yesterday following a test of the July 7th bull close. The bulls are disappointed after yesterday’s poor follow-through.
- Yesterday was a reminder that the market is still in a trading range, and even though the bulls got two good bull bars (last Thursday and Friday), that was not enough to conclude the market is always in long.
- The market is forming a triangle over the past two-three weeks. While the shape is not perfect, the most important thing to know is that the market is in breakout mode.
- The bulls want an upside breakout of the neckline (July 8) of the double bottom (June 30 and July 14). It is no surprise that a measured move up from the July 14 low to the June 28 projects up to 4276.25, a few points under the June major lower high.
- The bulls want to close above the June major lower high, which would end the argument of a bull trend and make the market either a bear trend or a trading range.
- The bears want the opposite. They want a bear breakout below the neckline (July 14) of the double top (June 28 and July 8th) and a measured move below the June 17 low.
- If the bears get a bear breakout below the June – July double top, the odds favor any bear breakout forming a final flag, and the market will likely reverse back into the June – July range at a minimum.
- The market may be forming consecutive wedge bottoms. The first wedge is 12/2/2022, 1/21/22, and 2/24/22, and the second wedge is 5/20/22, 6/17/22, and a new low as the third push.
- I mentioned yesterday that if the consecutive wedge bottoms are obvious, traders will be worried that the market will not make a new low below June. Traders do not want to miss out, so they may enter on limit orders above the June low just in case the market does not fall below June. This would form a higher low, the right shoulder of a head and shoulders bottom, instead of a wedge.
- July 14 is a higher low major trend reversal (right should be in head and shoulders bottom). This means July 14 is a higher low major trend reversal. It is important to remember that most major trend reversal attempts are not major and lead to minor reversals, which is consistent with yesterday. The bulls that bought the higher low (July 14) scalped out during yesterday’s bar.
- Overall, traders need to remember that until there is a breakout, there is no breakout. The bulls will see yesterday as a breakout pullback and look to buy.
- Bears see yesterday as a reversal and another lower high in a triangle. Traders should expect continued trading range price action until there is a breakout.
Emini 5-minute chart and what to expect today
- Emini is up 36 points in the overnight Globex session.
- The Globex has had a rally back to around a 50% pullback of yesterday’s selloff.
- The bears hope this rally is just a pullback that will lead to a second leg down; however, the rally up to the 50% pullback was strong, which increases the odds of sideways during today’s U.S. session.
- Also, since yesterday had consecutive sell climaxes into the close, the odds are that the market will have two hours of trading range trading before the end of the 2nd hour (8:30 AM PT).
- Even if today is a bear trend from the open for the first two hours and reverses up into a trading range for at least two hours (starting around 8:30 PT), that would satisfy the requirement.
- Traders should expect today to have a trading range open, which means a limit order market and many reversals up and down.
- When the bars are big and there are multiple reversals on the open, it is really easy to get down a lot of points and not be able to make it back up before the end of the day.
- So most traders are better off stepping aside until there is a clear, strong breakout closing far above/below all the bars to the left, with follow-through, or waiting for a credible stop entry such as a double bottom/top, or a wedge bottom/top.
- The most important thing on the open is to be patient and not try and force trades that do not look good. Most opens go sideways for the first 6-12 bars, so there is usually no rush to enter a swing for the first 6 bars.
- If today is going to be a trend from the open, there will be plenty of time to enter in the direction of the trend. One way is if the open forms consecutive strong trend bars, that would make the market buy/sell the close.
- Lastly, since today is a trading range, traders should pay attention to the open of the day, and if the open is in the middle of the day’s range late in the day, they should look for a retest back to the open.
Yesterday’s Emini setups


Al created the SP500 Emini charts.
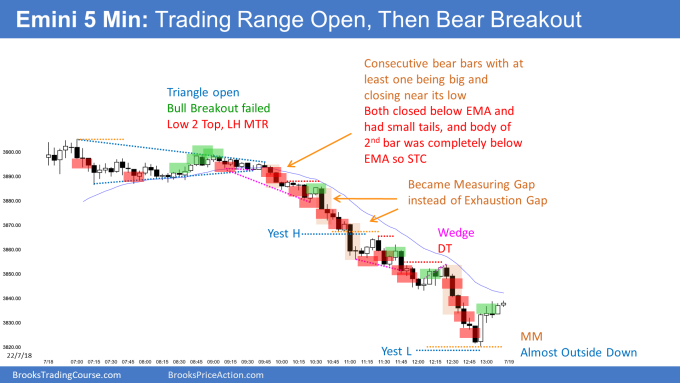
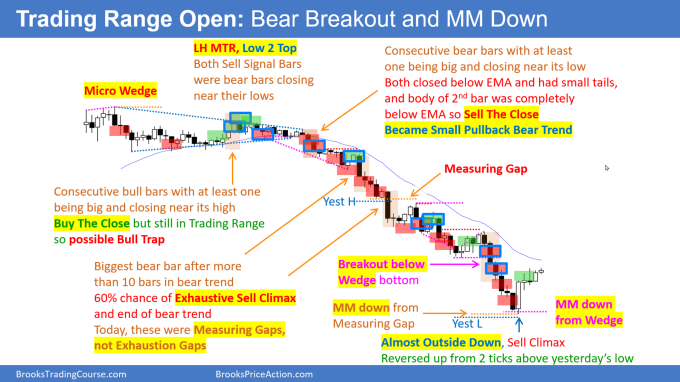
Here are several reasonable stop entry setups from yesterday. I show each buy entry with a green rectangle and each sell entry with a red rectangle. Buyers of both the Brooks Trading Course and Encyclopedia of Chart Patterns have access to a much more detailed explanation of the swing trades for each day (see Online Course/BTC Daily Setups).
My goal with these charts is to present an Always In perspective. If a trader was trying to be Always In or nearly Always In a position all day, and he was not currently in the market, these entries would be logical times for him to enter. These therefore are swing entries.
It is important to understand that most swing setups do not lead to swing trades. As soon as traders are disappointed, many exit. Those who exit prefer to get out with a small profit (scalp), but often have to exit with a small loss.
If the risk is too big for your account, you should wait for trades with less risk or trade an alternative market like the Micro Emini.
EURUSD Forex market trading strategies
EURUSD Forex daily chart

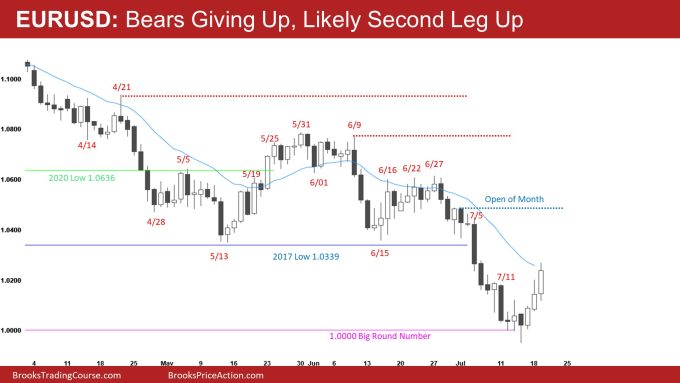
- The EURUSD has rallied 250 pips above the 1.000 big round number and is getting close to the 2017 low.
- The bears are giving up and buying back shorts. If today is a bull trend bar closing near its high, the market will probably be back to always in long, and the odds favor at least a small second leg up.
- The problem the bulls have is that the market is at the 20-period moving average (blue line).
- What traders do not know is whether the market will reach the 2017 low and bottom of the May – June trading range before a pullback.
- Even if today closes at the bar’s midpoint or below, the odds still favor a test of the 2017 low. However, it becomes more challenging to manage the trade.
- If today closes near its high, that would probably be enough to make the market buy the close for a second leg up. It would be better for the bulls if today closes far above the moving average or today and tomorrow are both strong bull closes.
- The bears hope that today is just a buy vacuum test of the moving average; however, the rally is strong enough that there are probably buyers below, and the odds favor a second leg up.
- One thing to note on the monthly chart is that the current month has a five-pip tail above the open. This means there is no tail above the current month, so as soon as this month opened, traders immediately sold, which is a sign of strength.
- The point I am trying to make above is that the selloff on the monthly chart since June 2021 is in a very tight channel which is climactic, and when you get a bar that the current month has no tail on top, it makes me think that the market is going to get above the July high soon which is 1.0488.
- Overall, the odds favor the market reaching higher prices over the next few weeks. Traders will be eager to see how today closes. Will the bulls buy into the bar’s close (daily chart), or will the bulls sell, creating a big tail today.
Summary of today’s S&P Emini futures price action and what to expect tomorrow

Al created the SP500 Emini charts.
End of day summary
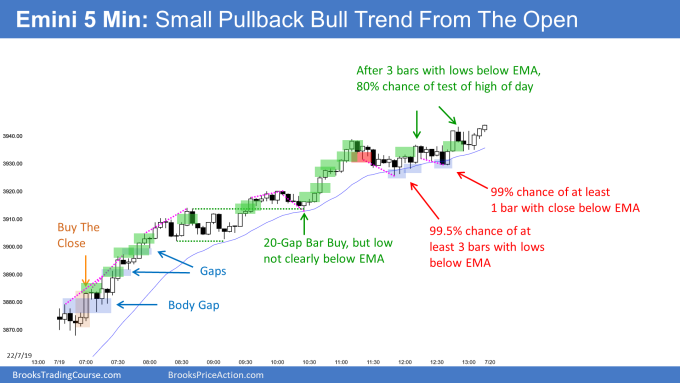
- Today was a small pullback trend from the open.
- The odds favored a trading range open for two-hours, beginning at least by the end of the second hour. However, the bulls got a buy the close market (always in long), increasing the odds of higher prices.
- The market formed a parabolic wedge top around 7:15 PT, but the bulls broke out above it and formed a measuring gap.
- The market remained always in long for the entire day.
- It is essential to realize that even though the market kept forming wedge tops, it is a small pullback bull trend which is the strongest type of trend.
- Smart bulls were not worried about a pullback because they knew any pullback was likely to be minor and led to more sideways to up trading at a minimum.
- It is also important to realize that the market was above the moving average all day, which means it was very bullish and strong.
- Trends do not immediately reverse; they instead go sideways in a trading range. This means the pullbacks today were from profit-taking bulls and aggressive bears scalping for a small profit (most traders should not short a strong bull trend).
- On a day like today, traders can buy, use a wide stop, and make money.
- These days are difficult because most small pullback bull trends go sideways at some point and do not continue up all day. This makes it hard to keep looking to buy all the way up.
- Today was a good day for the bulls on the daily chart. The bulls will try hard to get a successful breakout above the neckline (July high) of the double bottom. The bears want the opposite, and tomorrow will be a bear bar disappointing the bulls.
See the weekly update for a discussion of the price action on the weekly chart and for what to expect going into next week.
Trading Room
Traders can see the end of the day bar-by-bar price action report by signing up for free at BrooksPriceAction.com. Al talks about the detailed S&P Emini futures price action real-time throughout the day in the BrooksPriceAction.com on trading room days. We offer a 2 day free trial.
Charts use Pacific Time
When times are mentioned, it is USA Pacific Time. The Emini day session charts begin at 6:30 am PT and end at 1:15 pm PT which is 15 minutes after the NYSE closes. You can read background information on the market reports on the Market Update page.

