Trading Update: Thursday July 14, 2022
Emini pre-open market analysis
Emini daily chart
- The bears want a breakout below the June 30 breakout double top neckline (June 28 and July 8 high). Next, the bears would want a measured move down below the June 17 low.
- Bulls still want a double bottom high low major trend reversal with the June 30 low. Next, the bulls would want an upside breakout above the June 28 neckline and measured move up to 4,000 big round number and the June major lower high.
- The bulls had a bull trend day that closed around its midpoint yesterday. While this is good for the bulls, yesterday’s closing around its midpoint is a reminder that the market has been in a tight trading range on the daily chart since June 22.
- The bears have a 4-bar micro channel, increasing the odds of the first reversal down failing.
- The market may form a triangle on the daily chart, which is a breakout mode situation.
- The most important thing to remember here is that a tight trading range is a breakout mode pattern, which means the probability is close to 50% for the breakout up or down. If the likelihood clearly favored one direction over the other, the market would be breaking out.
- When traders look at the past two weeks, it seems confusing, which tells them the market is in a trading range.
- The bulls still want a double bottom higher low major trend reversal with the June 30 low. Next, the bulls would want an upside breakout above the June 28 neckline and measured move up to 4,000 big round number and the June major lower high.
- The bears want a breakout below the June 30 breakout neckline of the double top (June 28 and July 8 high). Next, the bears would want a measured move down below the June 17 low.
- It is possible the market has to fall below the June 17 low and form a wedge bottom with May 20, June 17, and a new low as the third push. This would also be a consecutive wedge bottoms pattern on the daily chart (December 3, 2021, January 24, February 24.
Emini 5-minute chart and what to expect today
- Emini is down 50 points in the overnight Globex session.
- The Globex market is testing the close of yesterday’s 5:35 AM PT report bar.
- Traders should pay attention to the June 30 low (3,741.25) since the market may test it during the U.S. day session.
- As like most days, traders should expect a trading range open and limit order market. This means traders should expect multiple reversals like yesterday.
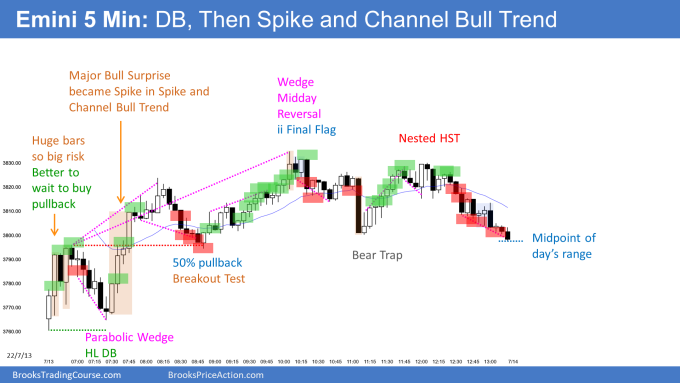
- Yesterday is a good example of how easy it is to buy too high or sell too low and take a big loss on the open that can be difficult to make up before the end of the session.
- Also, the bars will likely continue to be big like they were yesterday. This means traders need to trade smaller than usual.
- In general, there is a 50% chance on the open that the first breakout up or down will completely reverse. Most traders will be better off waiting for 6-12 bars before placing a trade. Take yesterday, for example; the market took 12 bars to form a double bottom that led to a good swing trade.
- Lastly, traders can look for a credible stop entry setup such as a double bottom/top, wedge bottom/top, or a strong breakout with good follow-through.
Yesterday’s Emini setups

Al created the SP500 Emini charts.
Here are several reasonable stop entry setups from yesterday. I show each buy entry with a green rectangle and each sell entry with a red rectangle. Buyers of both the Brooks Trading Course and Encyclopedia of Chart Patterns have access to a much more detailed explanation of the swing trades for each day (see Online Course/BTC Daily Setups).
My goal with these charts is to present an Always In perspective. If a trader was trying to be Always In or nearly Always In a position all day, and he was not currently in the market, these entries would be logical times for him to enter. These therefore are swing entries.
It is important to understand that most swing setups do not lead to swing trades. As soon as traders are disappointed, many exit. Those who exit prefer to get out with a small profit (scalp), but often have to exit with a small loss.
If the risk is too big for your account, you should wait for trades with less risk or trade an alternative market like the Micro Emini.
EURUSD Forex market trading strategies
EURUSD Forex daily chart

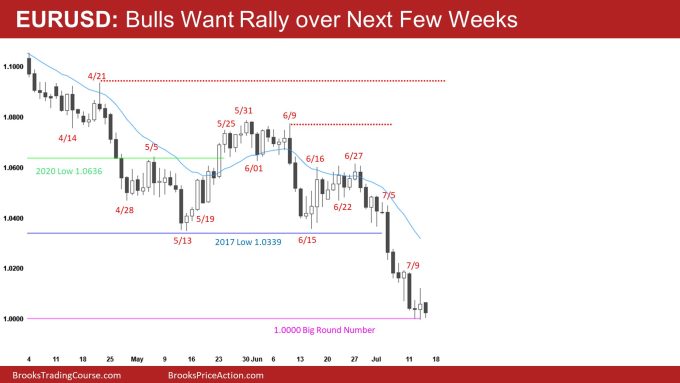
- The EURUSD went two pips below the 1.0000 big round number yesterday and reversed up 120 pips during the intra-day session. However, it sold off and closed below its midpoint on the daily chart.
- The bulls want an inside bar closing on its high, which would be a second entry buy following yesterday’s outside bar.
- Today the market is attempting to reverse up from above the 1.0000 big round number. The bulls hope that today will be a strong reversal bar closing on its high.
- Even if today is a bear bar, the odds are the EURUSD will bounce over the next couple of weeks. This was likely a sell vacuum test of major support 1.0000, and the daily chart is probably exhausted.
- The market will likely reach the 2017 low soon and the May – June two-month trading range.
- What traders do not know is how long it will take for the market to reach the 2017 low or the two-month trading range.
- Overall, traders should expect sideways to up over the next couple of weeks as bears begin to take profits at this 1.0000 big round number and bulls begin to buy for a rally.
Summary of today’s S&P Emini futures price action and what to expect tomorrow
- Al will post chart after the close.

Al created the SP500 Emini charts.
End of day summary
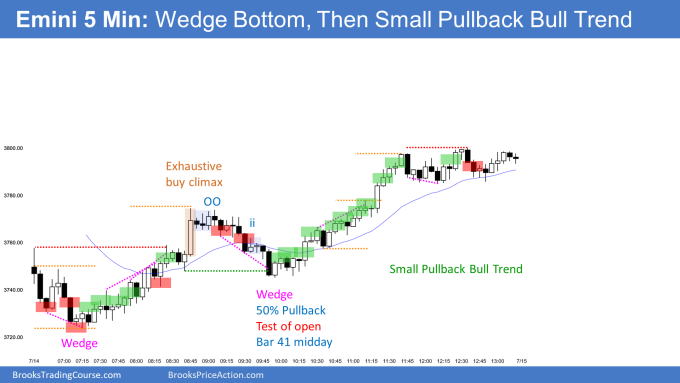
- Today formed a wedge bottom that led to a small pullback bull trend day.
- The market gapped down and formed an early wedge bottom on the open, leading to the day’s low.
- When the market formed several bull bars within the first hour, most traders would not be willing to buy the far below the moving average, which increased the odds of a rally.
- The initial pullback to the moving average 8:15 was in a tight bull channel, so most traders would not be willing to be short there. It is okay to exit longs; however, if you do, one should look to buy again like above the next bar (8:15).
- The bull breakout bar at 8:45 was likely exhaustion, and the odds favored a pullback to the low of the bar.
- The selloff to the 9:55 low was a wedge bottom testing a 50% pullback of the initial rally up and a test of the open of the day.
- The market continued in a small pullback bull trend for the rest of the day.
- One thing to notice is how difficult it was for the bears to make money on stop entries from 9:55 to 11:15. Even limit order bears had trouble making money.
- The bears ultimately got squeezed out and were forced to buy back shorts at 11:20 (this was a give-up bar), and the market continued higher.
- Today was a really good day for the bulls. The bulls reversed up from the June 30 lows on the daily chart and were able to create a strong signal bar closing on its high.
- The bulls will hope that tomorrow gaps up and forms a strong bull trend day, creating a strong entry bar for the bulls following today’s bull signal bar on the daily chart.
See the weekly update for a discussion of the price action on the weekly chart and for what to expect going into next week.
Trading Room
Traders can see the end of the day bar-by-bar price action report by signing up for free at BrooksPriceAction.com. Al talks about the detailed S&P Emini futures price action real-time throughout the day in the BrooksPriceAction.com on trading room days. We offer a 2 day free trial.
Charts use Pacific Time
When times are mentioned, it is USA Pacific Time. The Emini day session charts begin at 6:30 am PT and end at 1:15 pm PT which is 15 minutes after the NYSE closes. You can read background information on the market reports on the Market Update page.

