Emini 60 minute head and shoulders bottom despite China trade war
I will update again at the end of the day.
Pre-Open market analysis
The Emini has been sideways for 2 weeks. But, it is forming another higher low. On the 60 minute chart, Monday was a higher low major trend reversal after Thursday’s lower low major trend reversal. Therefore, this is a 2 week long head and shoulders bottom in an oversold market.
Tuesday was a short day and an inside day. It is therefore both a buy and sell signal bar for today. Since its range was small, there is an increased chance that today will trade above its high and below its low. Either breakout can come 1st. This would create an outside day. Therefore, traders will look to sell a reversal down from above Tuesday’s high and buy a reversal up from below its low. But, since the week of the 4th of July is typically the 2nd quietest of the year, there is a smaller chance of a big trend day today.
Overnight Emini Globex trading
The Emini is up 21 points in the Globex session. It will therefore probably gap above Tuesday’s high, which would trigger a minor buy signal.
When there is a big gap, there is an increased chance of a trend day. The trend is more likely to be in the direction of the gap (here, up). However, a big gap up means that the 5 minute chart will be far above its 20 bar EMA. Most traders do not want to buy far above the average price. Consequently, the odds are that any rally on the open will likely stall within an hour or so. If so, the bulls will want the market to go sideways to down until it gets closer to the average price. Then, they will look to buy a reversal up.
If the bears can create 2 – 3 big bear bars on the open, day traders will look for a Trend From The Open bear trend day. They have a 20% chance of getting this. Since big gaps up usually lead to a trading range for the 1st hour or so, the bears will look for some type of a double top for an early high of the day.
Because most big gap up days usually become either bull trend days or trading range days, that is what is most likely today.
Yesterday’s setups
I did not trade earlier this week, so no setups chart posted.
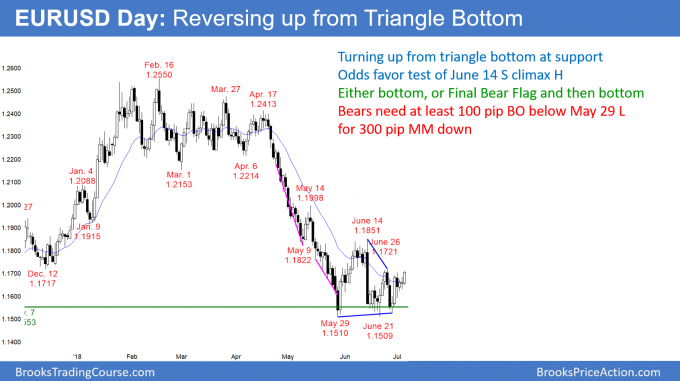
EURUSD Forex market reversing up from Triangle Bottom to test sell climax high
The EURUSD daily Forex chart is reversing up from a triangle bottom. This bottom is also a double bottom with the November 7 major higher low. The odds are that the rally will continue at least up to the June 14 sell climax high.
The EURUSD daily Forex chart sold of in a series of sell climaxes in May. But, the selling stopped at the November 7 low, which is major support. After several attempts to break below, the bears are giving up. The odds are that the 3 week rally will continue up to the June 14 sell climax high at around 1.1850.
That is also the neck line of the May 29 and June 21 double bottom. The bulls then want a 300 pip measured move up to above the March 1 low. That is the breakout point of the May sell climax.
There is currently a 30% chance of this happening. However, the bulls have a 60% chance of getting to the June 14 high before the bears get a breakout below the May 29 low.
A triangle is a trading range, and my 80% rule says that trading ranges resist breaking out. Consequently, the rally will probably stall above 1.1800 for at least a week or two. The market will then decide between breaking to the upside to test the May 14 high at around 1.20, and reversing down to below the triangle. At the moment, it is slightly more likely that the daily chart will test 1.2000 within a couple months.
Overnight EURUSD Forex trading
The EURUSD 5 minute Forex chart rallied 70 pips overnight. It is now testing the June 26 high of 1.1721. While the rally might stall here fore a few days, there is a 60% chance that the bull channel on the 60 minute chart will continue up to the June 14 high of 1.1851. Therefore, day traders will buy pullbacks for swing trades and scalps. When the 5 minute chart enters trading ranges, the bears will sell reversals down for 10 pip scalps.
Summary of today’s S&P Emini futures price action and what to expect tomorrow
Here are several reasonable stop entry setups for today. I sometimes also show limit order entries and entries on the close of bars. My goal with these charts is to present an Always In perspective. If a trader was trying to be Always In or nearly Always In a position all day, and he was not in a position at the moment, these entries would be logical times for him to enter.
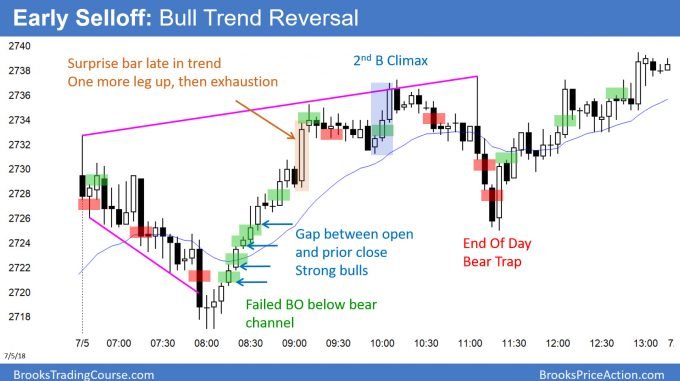
The Emini gapped up and sold off to just above yesterday’s low. It then, however, reversed up to above yesterday’s high, and closed at the high.
After a month of lower highs on the 60 minute chart, the bulls finally got above the most recent 60 minute lower high. But, that high was relatively minor. Since the momentum up is good, the odds favor a rally to above the June 27 major lower high within a few days.
Tomorrow is Friday and therefore weekly support and resistance can be important at the end of the day. The most important weekly price is the high of the week. The bulls want the week to close on its high. It would therefore be a buy signal bar on the weekly chart for next week.
See the weekly update for a discussion of the price action on the weekly candlestick chart and for what to expect going into next week.
Traders can see the end of the day bar-by-bar price action report by signing up for free at BrooksPriceAction.com. I talk about the detailed S&P Emini futures price action real-time throughout the day in the BrooksPriceAction.com trading room. We offer a 2 day free trial.
When I mention time, it is USA Pacific Standard Time (the Emini day session opens at 6:30 am PST, and closes at 1:15 pm PST). You can read background information on the intraday market reports on the Intraday Market Update page.


