Democratic Convention stock market rally: Updated 6:55 a.m.
Like most days over the past 2 weeks, the Emini sold off on the open. Then bulls again want an opening reversal, today, at the 60 minute moving average, and an early low of the day. The bears want a strong breakout below the 60 minute moving average and a Trend From The Open Bear Trend.
Because the past 8 days have been in a tight trading range and most of the day trading has been within trading ranges, the odds are against a strong trend. This is especially true with the uncertainty of Wednesday’s FOMC report.
While a strong trend is unlikely, there will probably be at least one swing today, and possibly more. If there is a strong breakout up or down, traders will swing trade at least part of their position. Until then, they will mostly scalp.
Most of the opens over the past 2 weeks have had multiple reversals and limit order trading. Today’s open is consistent with that. While the Emini is Always In Short, the bears need strong follow-through selling to convince traders that this is a swing down. The bulls are trying for an reversal up. The follow-through after big bear bars has been bad. This usually means that the selloff is a bear leg in a trading range, or the start of a weak bear trend day.
The odds favor sideways for an hour or more, and a day with lots of trading range price action. However, given that the daily chart is in a bull flag, the bulls have a chance of a bull trend day.
Democratic Convention stock market rally will probably fail: Pre-Open Market Analysis
The weekly chart might be the most important chart this week. While the Emini has rallied strongly for 4 weeks, the bodies on the weekly chart are getting smaller. Furthermore, last week had a prominent tail on top. Most noteworthy is that the protective stop is far below. Consequently, there is a trend in the reduction of bullish momentum.
Markets have inertia. This means that their price action resists change. As much as the bulls created a strong bull trend, they now are getting quicker to take profits. This trend toward profit taking and bears beginning to sell will probably continue this week.
It is therefore likely that this week will be less bullish than last week. The candlestick pattern will show the change. Traders will look for a smaller bull body, a bigger tail on top, or a bear body. To get a bigger tail on top, the Emini will probably rally early in the week and then sell off later in the week.
Likely profit taking on the daily chart
This is consistent with my weekend comments about the daily chart. Because the protective stops are about 5% below, there is too much risk for many institutions. They will begin to look for reasons to sell. Furthermore, they want to sell at a good price. One way to do that is above prior bar. Since the Emini daily chart has had an 8 bar tight trading range, bulls will sell a 1 – 3 day bull breakout. Hence, the tight trading range will probably become the Final Bull Flag.
This does not mean that a bear trend will follow. However, it probably will lead to a TBTL Ten Bar Two Leg correction on the daily chart. The correction typically tests the bottom of the Final Flag. It often falls for a measured move down, or to some other support. Obvious support is the breakout point at the top of the 2 year trading range.
Final Flag on monthly chart
The monthly chart also has a potential Final Flag reversal pattern. Since the trend has lasted for an unusually big number of bars, the odds of a Final Flag top are 50% over the next 5 bars. Five bars is 5 months. Therefore, the rally can go much higher before the reversal.
As a result of the credible setup on the monthly chart in an overbought market, the odds are that traders will be concerned. If enough bulls quickly take profits on a minor reversal down and enough bears sell, there could be a relatively sharp selloff.
Two week selloff on daily chart
Because the momentum up on the weekly and daily charts is so strong, bulls will probably buy the selloff after a week or two. A two week selloff will probably fall about 40 points, which is about 1.5 – 2%. That is a fairly common size for a minor reversal.
FOMC on Wednesday
Whether or not the Fed raises interest rates, the odds favor a tail on the top of the weekly chart. This means that the odds favor a rally and then a reversal down. The FOMC report might be the excuse for the reversal down. If the Fed raises rates and uses surprising wording, the reversal might be severe enough to create a Final Flag reversal on the monthly chart.
Globex Emini
The Emini is up 1 point in the Globex market and in a trading range. This does not change any of my thoughts.
Forex: Best trading strategies
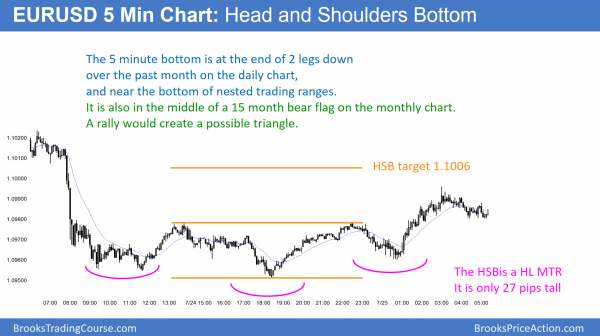
The 5 minute EURUSD Forex chart turned up from a small Head and Shoulders Bottom (HSB) overnight. All HSBs are Higher Low Major Trend Reversals (HL MTRs).If the rally extends to about 100 pips, the monthly trading range would then become a triangle.
The EURUSD daily chart has been in a bear trend for 3 weeks. The bears want this to be the start of a trend that will accelerate down below the yearlong trading range. The bulls see this 3 week bear trend as two legs down in a 5 week trading range.
When a bear trend lacks consecutive big bear trend bars and has many bars with small bodies and prominent tails, it is more likely a leg in a trading range than the start of a strong bear trend. The odds are that the daily chart is probing for the bottom of the trading range. That bottom might be around the current price or even below the June 24 big bear breakout.
Long-term support
The next support is the 1.0821 bottom of the March 10 huge bull breakout day. As long as the bulls are able to keep the selloff from falling below that support, they have a good argument that the selloff is a pullback from that rally.
The next support is the bottom of the pullback from the December 3 huge bull trend day. That pullback was on January 5, and its low was 1.0710. The EURUSD can still fall below that support and yet still be in the trading range that began with the March 13, 2015 sell climax.
Trading ranges always have many levels of support. Rallies usually only come after a test of, and often a break below, a major support level. Until there is a strong breakout fall below support, the probability favors a reversal. Hence, this month-long selloff will probably reverse up soon. While the bulls will probably take control, the rally will probably just be another bull leg in the trading range and not a bull trend.
Overnight Forex trading
While the 5 minute chart turned up from a Higher Low Major Trend Reversal, the pattern was only 20 pips tall. More noteworthy is that the chart is near support and a small pattern can be the start of a move up on the daily chart. After 3 pushes down on the daily chart, the bulls want a reversal up.
FOMC Report on Wednesday
Wednesday’s FOMC announcement is a catalyst and it could lead to a big move up or down in all financial markets. While the EURUSD daily chart has been trending down for a month, the selloff has been weak and within a trading range. A rally after the report is more likely than a bear breakout below a bear channel.
However, a strong bear breakout could become a measuring gap. Hence, the EURUSD could quickly fall 200 pips and get near the bottom of the 15 month trading range.
Summary of today’s S&P Emini futures price action and what to expect tomorrow
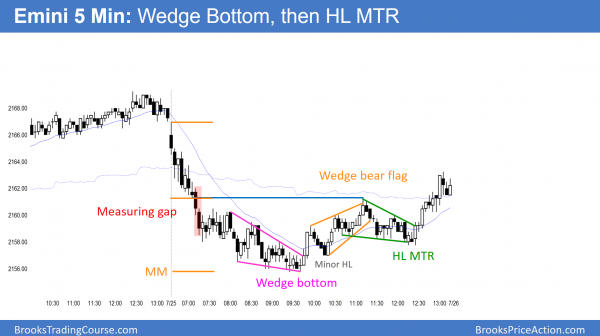
After a weak selloff for the first hour, the Emini reversed up from a wedge bottom at a measured move target. It rallied in 2 big legs up to the 60 minute moving average for the 2nd half of the day. Most of the day formed a big trading range.
Today was the 8th day in a tight trading range on the daily chart. Hence, the chart is in breakout mode. While it might break out tomorrow, a big move will probably come after Wednesday’s 11 a.m. announcement.
See the weekly update for a discussion of the price action on the weekly candlestick chart and for what to expect going into next week.
Traders can see the end of the day bar-by-bar price action report by signing up for free at BrooksPriceAction.com. I talk about the detailed S&P Emini futures price action real-time throughout the day in the BrooksPriceAction.com trading room. We offer a 2 day free trial.
When I mention time, it is USA Pacific Standard Time (the Emini day session opens at 6:30 am PST, and closes at 1:15 pm PST). You can read background information on the intraday market reports on the Intraday Market Update page.


