Posted 7:05 a.m.
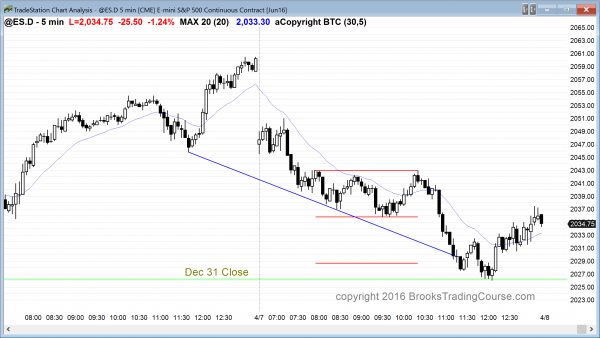
The Emini opened with a big gap down. It tested yesterday’s higher low and tried to form a big double bottom bull flag. It has been in a tight trading range and it is in breakout mode. Since it is at support, the odds favor a bull breakout and a measured move up. If there is instead a bear breakout, it probably will fail.
While it is possible that today could be a strong trend day up or down, this trading range open and the big gap down make a trading range day more likely. Swing traders are waiting for a strong breakout up or down. Scalpers have had many limit order scalps so far. There will probably be at least one swing trade today, and probably at least 2.
Pre-Open Market Analysis
S&P 500 Emini:
The Emini had a climactic rally yesterday so there is a 50% chance of follow-through buying in the 1st 2 hours, and a 75% chance of at least 2 hours of sideways to down, beginning by the end of the end hour. The Emini is down 10 points in the Globex session, which is big enough to make the odds of a trading range high once the day session opens. Big Up yesterday, Big Down on the open means Big Confusion and Big Disappointment. Confusion and disappointment are the hallmarks of a trading range.
Th Emini has been in a trading range for 7 days, and when it is in a trading range, the 5 minute chart also tends to spend more time in trading ranges. There will probably be at least one swing up and one swing down today, but the Emini might need an hour or two before it decides which comes 1st. After a swing lasts for 2 – 4 hours, day traders will begin to look for an opposite swing.
If there is instead a strong trend day up or down, traders will swing trade all day. Since yesterday was a strong bull trend day and the Emini is entering a trading range on the daily chart, the odds of a strong bull trend day are less than the odds of a strong bear trend day. A trading range day is most likely.
The daily chart is transitioning from a strong bull channel into a trading range. Unlike in February and March, a big bull day now is more likely to be sold instead of bough on the next day. Bulls are selling high to take profits, instead of buying high, betting on higher prices. Bears see every rally as a chance to sell at a great price because they now believe that the bulls will take profits on the close of strong bull trend bars and above prior highs.
Was Monday the top of the trading range for the next month? It might be, but there is about a 50% chance that it might be a little higher. The trading range will probably last at least a month and be about 100 points tall (5% pullback), like the other 4 trading ranges over the past 2 years. The past 2 years have been in a 300 point tall trading range.
Since there will probably be a lot of trading range price action, traders will sell rallies and buy selloffs. If today is a bad follow-through day on the daily chart, and it probably will be since the Emini daily chart is probably now in a trading range, then the day will either have a bear body (close below the open), or only a small bull body. If it has a bull body, the follow-through tomorrow or Monday will probably be bad, and there will soon be a bear trend day that reverses most of yesterday’s gains. There is still a 40% chance of a breakout to a new high, but only a 30% chance that it will be followed by a 300 point measured move up.
Traders use these probabilities to be prepared for setups. Those who trade the markets for a living know that one of the best setups comes when there is a high probability setup. That «best» setup is a Pain Trade. A pain trade is when the market relentless does the opposite of what is likely.
For example, if a reversal down at the top of the 2 year trading range is likely, always be ready for the opposite. If the opposite happens, it will usually be in the form of a small pullback bull trend that looks weak and it constantly looks like it is about to reverse. The bull bodies are small and have prominent tails, and there are 1 – 3 bar pullbacks that come every few bars. However, the pullbacks are small and there are gaps between the bottom of one or more pullbacks and the breakout point.
Forex: Best trading strategies

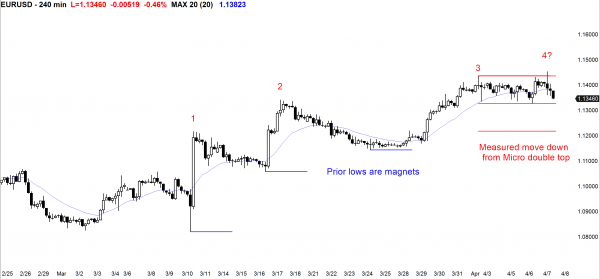
The EURUSD is forming its 5th consecutive doji day on the daily chart. For the past few days, I said that at least one more push up was likely before the EURUSD daily chart might try to form a Low 4 sell setup. The rally over the past 24 hours and the reversal down last night is an attempt by the bears to create a top for the next couple of weeks. The overnight selloff did not reverse the entire rally, and the EURUSD might therefore be in a broad bull channel. If so, it could continue higher and test the October 15 lower high around 1.1500.
However, the bulls completed their minimum objective overnight, and a selloff down to at least the March 24 higher low around 1.1150 is now more likely. The bears need a strong breakout below the April 6 low of 1.1324. This is the neck line of the micro double top of the past 5 days, and it could lead to a swing down. As long as the bulls are able to prevent a strong bear breakout, they still can test higher. However, the ingredients are there for a swing down of at least 200 pips.
Until there is a breakout up or down, day traders will continue to scalp, like they been doing for the past 6 days. The EURUSD has been in a 40 pip trading range for the past 5 hours, and traders have been scalping. They often use limit orders to sell above prior highs and buy below prior lows. Other traders wait for reversals and enter on stops.
Summary of today’s S&P Emini futures price action and what to expect tomorrow
The Emini had a bear trend resumption type of bear trend day, and bounced up from the December 31 close and the daily moving average.
The trading range on the daily chart is becoming clearer. Although it is only about 40 points tall, it will probably be about 100 points tall within a month. The bulls can still get a breakout to a new all-time high, but the odds favor a trading range for about a month, and the probability of a bear breakout below the 2 year trading range is still slightly higher than that for the bull breakout.
Today had consecutive sell climaxes so tomorrow will probably have at least 2 hours of sideways to up trading. It might have already begun over the final hour of today.
Tomorrow is a Friday so weekly support and resistance can be important. The odds are that this week will have a bear body and form a micro double top with the high of 3 weeks ago. The trading range is likely to continue.
See the weekly update for a discussion of the price action on the weekly candlestick chart and for what to expect going into next week.
Traders can see the end of the day bar-by-bar price action report by signing up for free at BrooksPriceAction.com. I talk about the detailed S&P Emini futures price action real-time throughout the day in the BrooksPriceAction.com trading room, and a 2 day free trial is available.
When I mention time, it is USA Pacific Standard Time (the Emini day session opens at 6:30 am PST, and closes at 1:15 pm PST). You can read background information on the intraday market reports on the Intraday Market Update page.


