Posted 7:09 a.m.
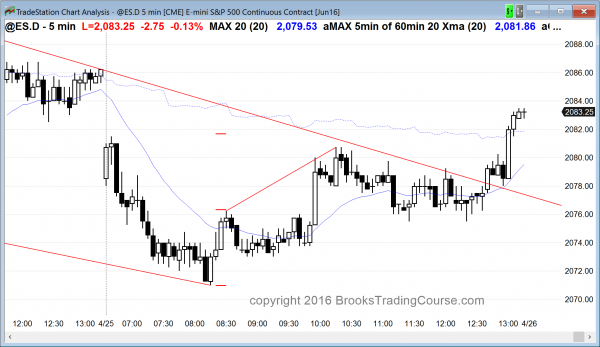
The Emini tested yesterday’s low, but stalled in yesterday’s lower trading range. While the Emini is Always In Short, the initial sell signal bar at the high of the day had a bull body and it was not quite at the moving average. This happens more often in a trading range than in a bear trend, which means that this initial selloff will probably become a bear leg in what will end up as a trading range. Even if there is a breakout below yesterday’s low, bulls will buy it, expecting it to fail. A reversal up would also create a 5 day wedge bull flag.
The bears need to start to form big consecutive bear bars if they are going to get a bear trend day instead of a bear leg in a trading range. The bulls need a strong reversal. Limit order bulls and bears have made money. The odds are the Emini will be in a trading rang for the 1st hour or two, and that whatever swing that follows will be followed by an opposite swing later in the day. A trading range day is likely.
As always, if there is a strong breakout up or down, traders will change their minds and trade the day like a trend day. That is not the case at this point.
Pre-Open Market Analysis
S&P 500 Emini: Day traders see a weak bull flag candlestick pattern
Friday was a High 1 buy signal bar. It will trigger if today trades above Friday’s high. The rally of the past month has allowed bears to consistently make money by selling above prior highs. This happens in a bull trend when the trend is beginning to transition into a trading range. The bottom of the range is also around the December 31, which is another magnet. As long as the Emini is above that price, it is up on the year.
The Emini made an all-time high last week after a 9 month pullback. Instead of breaking out strongly, it immediately reversed. This is more common when a breakout will not be successful. While it is possible that the bulls will get their measured move up, based on the 300 point height of that 2 year trading range, it is more likely that they will not. Whether or not they do, there is a 60% chance of at least one 20% correction coming at some point this year. Tops and reversals are rarely clear in trading ranges until the reversal has gone a long way. Most traders end of trading, taking quick profits and then looking for the next trade in either direction.
The 3 day selloff on the 60 minute chart has been in a tight channel. Tight channels are usually followed by trading ranges and not bull trends. The odds are that any rally today will probably be limited, even though the 3 day selloff is a 2 day bull flag on the daily chart. It is more likely that the 1st rally attempt will be sold and that the 60 minute bears will get at least a 2nd leg sideways to down before the bulls will be able to test last week’s high.
A 60 minute trading range means that swings up or down on the daily chart will probably not last all day. This means that there will be at least 2 swings today and that today will be a trading range day. Traders never know in advance if the 1st swing will be up or down. The result is usually a trading range open.
The weekly chart is in a buy climax. There is a 90% chance that this week will trade below last week’s low, or next week will trade below this week’s low.
The monthly chart closes on Friday. While the month so far is a bull trend bar, it is small and at the top of the 2 year trading range. The low of the month is 2026, which it the April 7 low, and the bottom of the potential Final Bull Flag on the daily chart. The Emini might get drawn to that price by the end of the week.
Forex: Best trading strategies
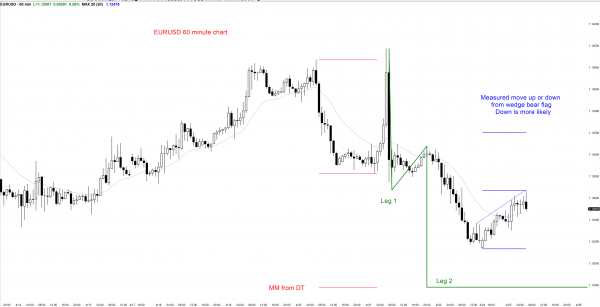
The daily Forex chart of the EURUSD triggered a head and shoulders top with Friday’s selloff. The overnight market reversed up. This means that the follow-through selling has been weak. It reduces the chances that the bears will get a measured move down based on the 200 pip height of the top. However, the overnight rally as weak and it has had 3 pushes. It is a wedge bear flag. There is a 60% chance that there will be a bear breakout below the bear flag. This would result in either a trading range, or another new low in the bear trend that began with the March 21 strong bear reversal.
That reversal was strong enough to make some kind of measured move down likely, like a Leg 1 = Leg 2 measured move, or a measured move based on the height of the double top on the 60 minute chart. That double top was about 100 pips tall, and Friday’s selloff missed the 1.1180 target by about 40 pips. The odds are that the EURUSD will fall at least a little more over the next few days.
There is a 40% chance of a bull breakout above the wedge bear flag. The goal would then be a measured move up of about 50 pips, which is the height of the bear flag on the 60 minute chart.
Summary of today’s S&P Emini futures price action and what to expect tomorrow
There was a swing down on the open, followed by a swing up. The day was a trading range day that closed near the high.
As I expected from the early price action and the context, the day had both a swing down and a swing up and it was a trading range day. The odds are that tomorrow will be similar. The Emini might be waiting for Wednesday’s FOMC report.
…
See the weekly update for a discussion of the price action on the weekly candlestick chart and for what to expect going into next week.
Traders can see the end of the day bar-by-bar price action report by signing up for free at BrooksPriceAction.com. I talk about the detailed S&P Emini futures price action real-time throughout the day in the BrooksPriceAction.com trading room, and a 2 day free trial is available.
When I mention time, it is USA Pacific Standard Time (the Emini day session opens at 6:30 am PST, and closes at 1:15 pm PST). You can read background information on the intraday market reports on the Intraday Market Update page.


