Market Overview: FTSE 100 Futures
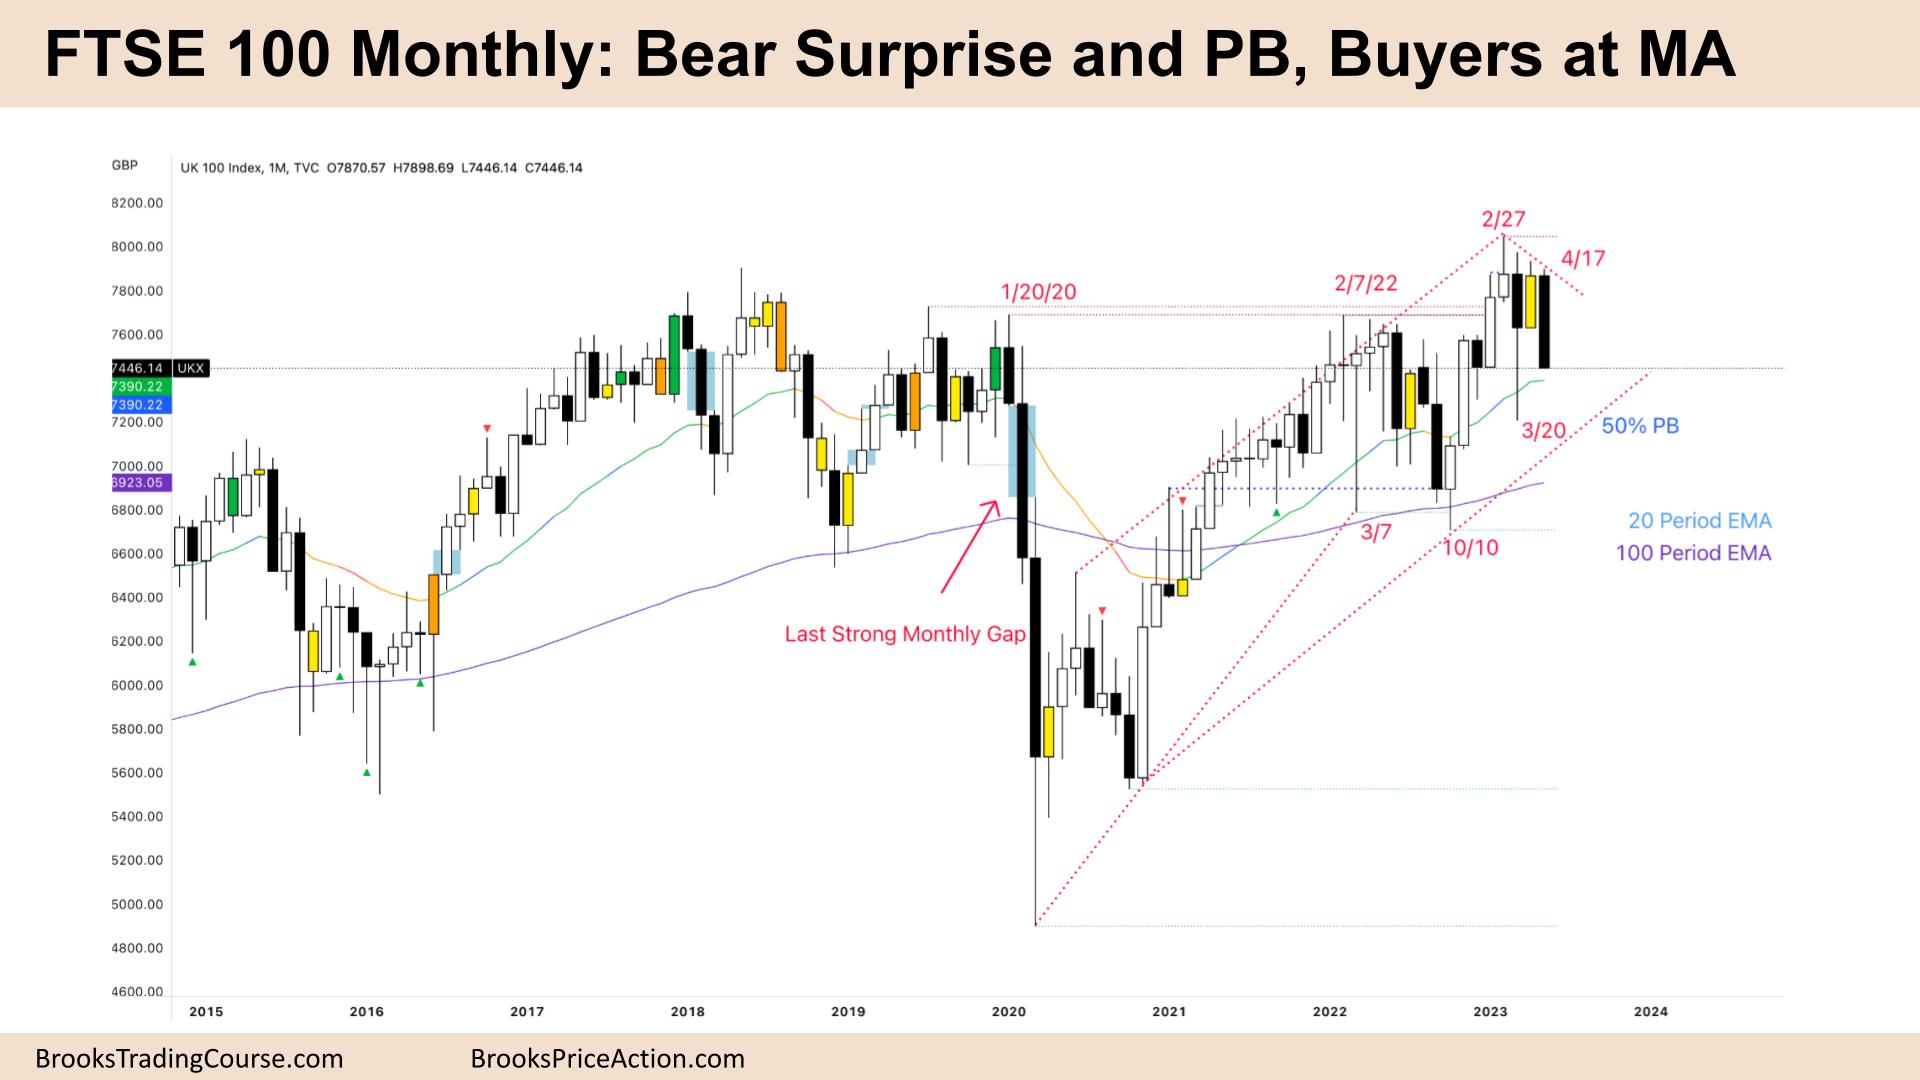
FTSE futures market moved lower last month with a bear surprise pullback closing above the MA. Bulls see a pullback to the moving average (MA) and have bought here for 2 years. They will likely do so until it is no longer profitable. Bears will look to sell a pullback, maybe 50% of this bar, for a second leg down. Because the gaps are closed, we can expect more trading range (TR) price action and bad follow through.
FTSE 100 Futures
The Monthly FTSE chart

- The FTSE 100 futures was a bear bar closing on its low so we might gap down on the 1st.
- Note that this report was written after the end of the month; we know it did not. In fact, it reversed immediately!
- The bulls see a small pullback bull trend, a tight bull channel with only one bar below the MA. So it is strong.
- The bears see a trading range and a failed breakout above the high.
- Stop-order bulls are making money. Limit bulls are making money buying anything bearish and buying below bars and the MA.
- Stop-order bears have struggled to make money. Limit order bears are making money – selling above bars.
- Because it is easier to make money as a bull, we can say it is always in long. But most always in long bulls exited below February and are looking for a bull bar to get back in.
- March was a bear surprise – yet bullish because it closed in the top half.
- May was a bear surprise. Some bears will expect a small second leg down. But the problem is it is still within the March bar – triangle and low in a tight TR – Breakout Mode.
- We also closed above the MA, so it has been a buy zone for 24 months.
- Big bars in trading ranges often attract profit-taking and counter-trend traders betting against follow-through.
- The bulls might be trapped above the high of the prior trading range, which was a reasonable breakout buy. But the follow-through was bad. They bought a 50% pullback and some scaled out breakeven.
- If you bought the close of Feb and scaled-in, you made money on your second entry.
- The month prior was an inside bar, and BOs of inside bars fail at a higher rate. So we should get back to the low of the IB before traders decide.
- Traders should expect sideways to up around the moving average.
- The low probability event would be a follow-through bear bar.
The Weekly FTSE chart

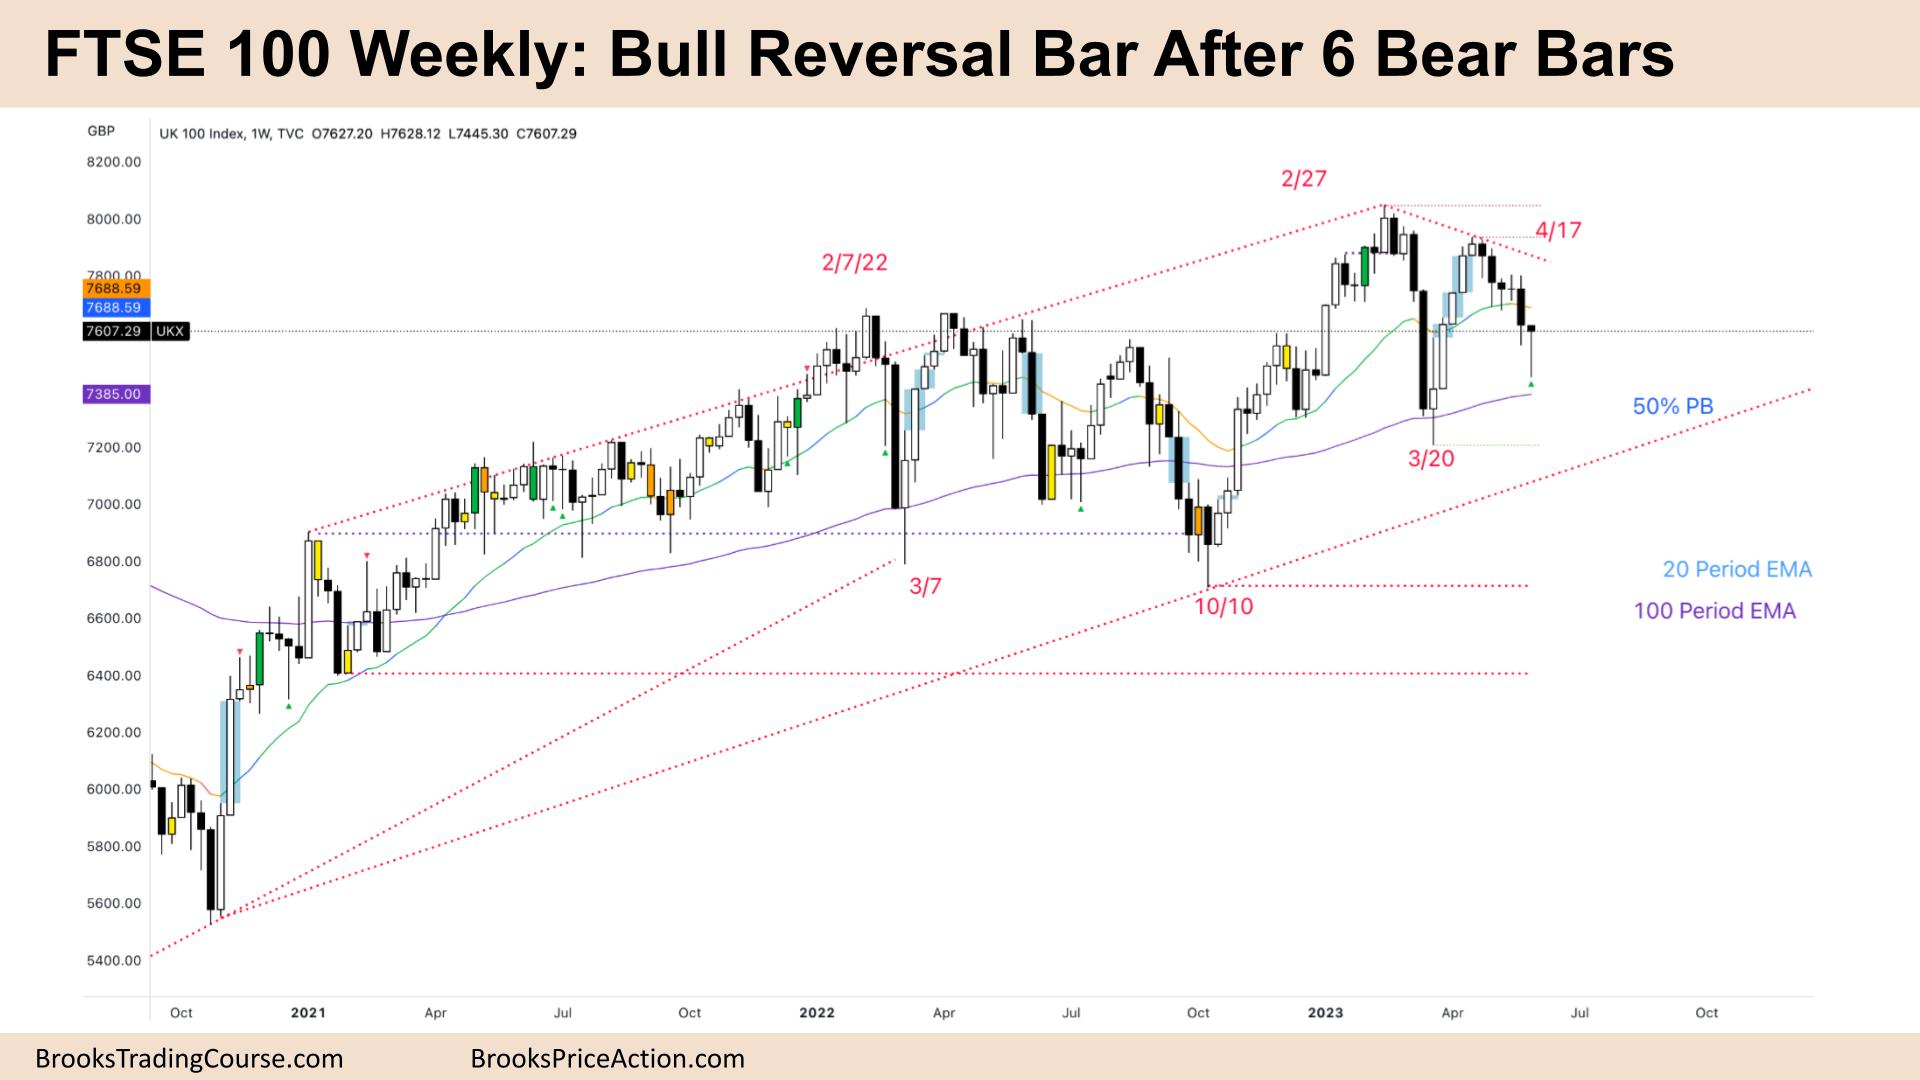
- The FTSE 100 futures on the weekly chart was a bear bar but a bull reversal bar. It closed near its high.
- It is a possible reversal bar with a strong bear breakout below last week.
- Bulls will see it as a higher low and look for a High 1 or High 2 to buy above.
- Bears will see it as a bear BO, tight bear channel and look for another leg down.
- It is the second consecutive bear bar below the MA, which we have not had in a long time. So the nature of the market is changing.
- Bulls must work hard next week to trap bears and convince the market to go higher.
- It is not surprising we came back at the prior all-time high.
- We broke out of the trading range and returned to the BO point. It is indecision; hence, most traders should trade it like a trading range.
- It was a Low 2 short, but a bad signal bar 2 weeks ago made the better short below last week.
- You can see that bears who sold at the close of March got a chance to exit breakeven on that trade and make money on their second trade.
- Bulls will look to do the same, buy the MA, buy the micro channel pullback and then buy lower to make money.
- It is a bull bar, so it is not a great buy signal for next week. And the bear bar is not strong, so better to not sell above and instead to sell above a stronger bear bar.
- Most traders should be flat waiting for a reasonable stop entry.
Market analysis reports archive
You can access all weekend reports on the Market Analysis page.

