Market Overview: FTSE 100 Futures
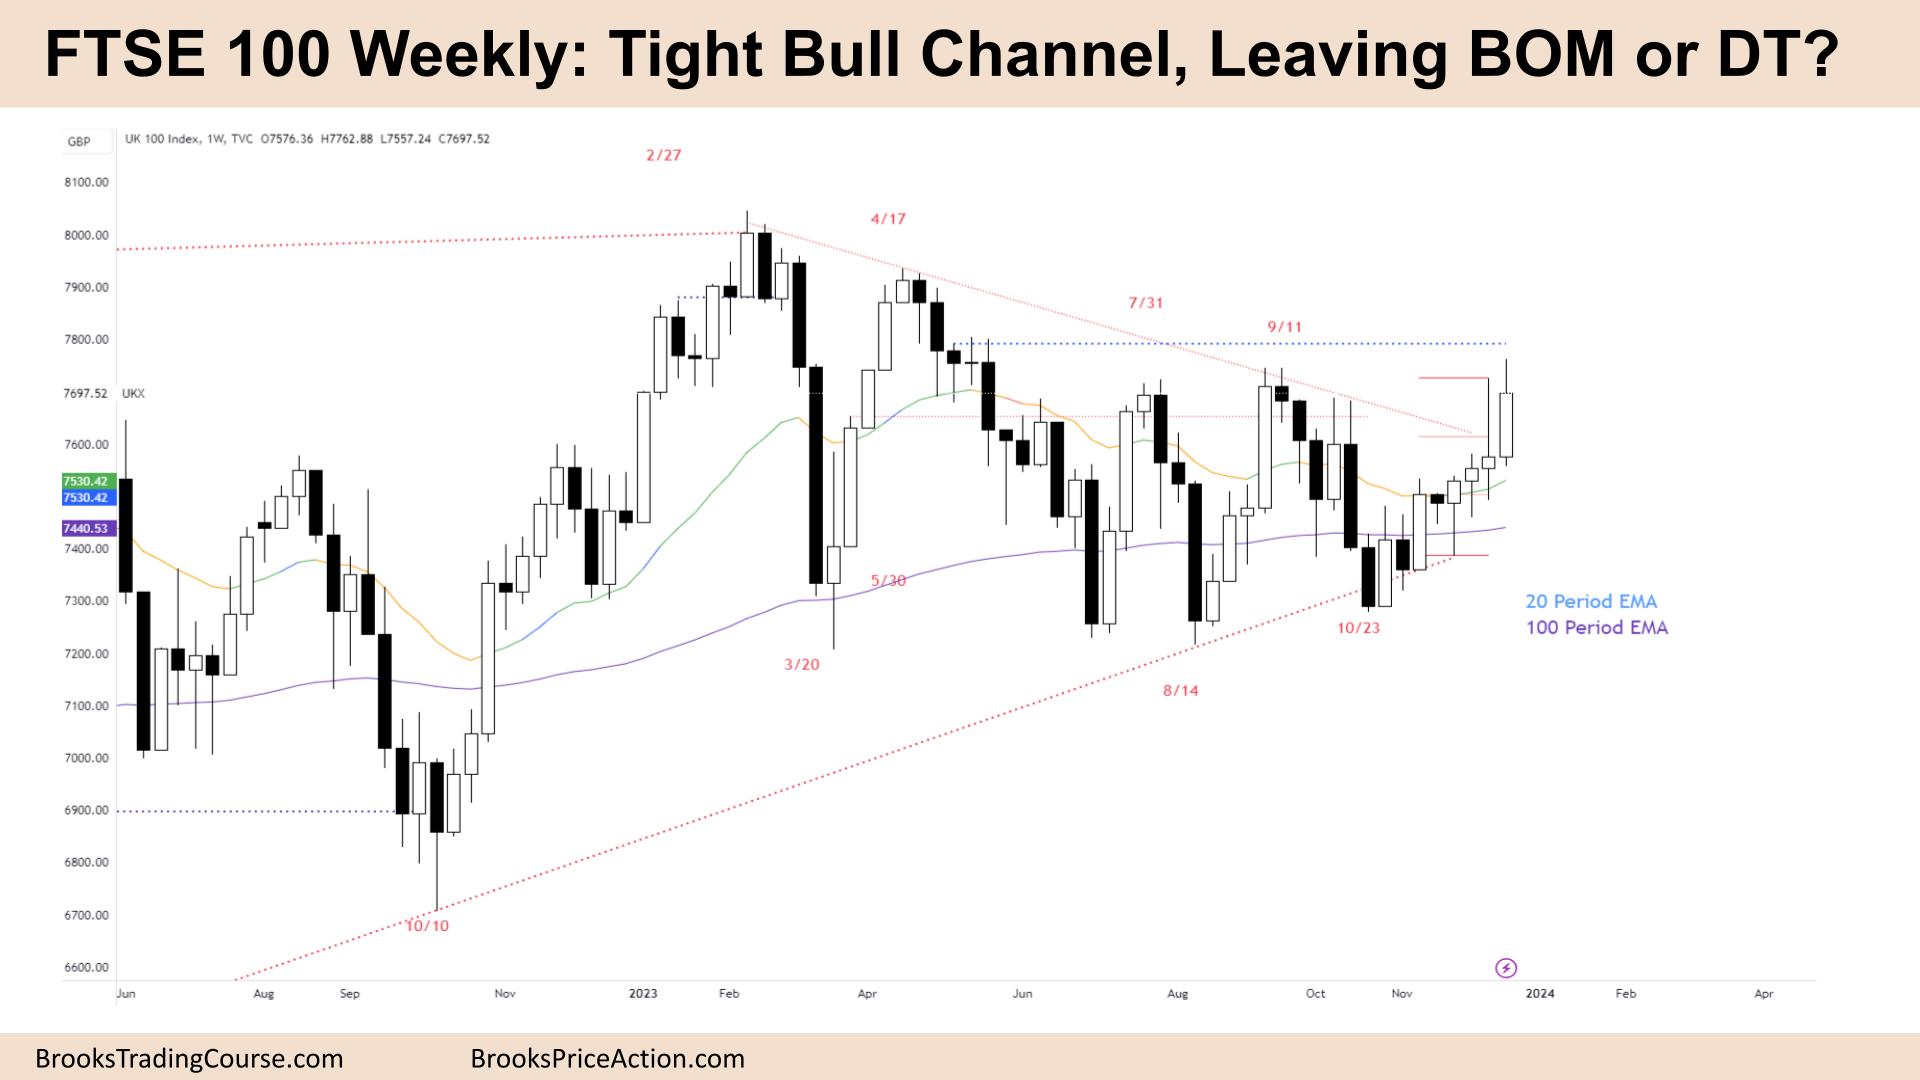
FTSE 100 futures went higher in a tight bull channel as we left breakout mode with several small consecutive bars higher. Bears want a sell signal to fade the top of the trading range, but we are now getting many small bars, so it could be the first leg of a swing up. It could be the start of a wedge bull flag on the monthly chart, a High 3. So traders will get long on a breakout and pullback for a swing up. But trading ranges are disappointing, and all breakouts have failed recently. Bears might already see the tail in the prior week as the first attempt.
FTSE 100 Futures
The Weekly FTSE chart

- The FTSE 100 futures went up last week in a tight bull channel from BOM at the MA.
- The bar closed above its midpoint but not above the prior bar’s high. So it is not as bullish as it could be.
- We are always in long.
- It is the fourth consecutive bull bar, so traders expect a second leg, even if just one bar.
- Limit order traders have not been able to buy below the bar. They have entered in the lower 50%, indicating buying pressure.
- Stop order bears have been scaling in above the bear spike, betting that the TR price action will continue. They have been able to get back to their original entries each time.
- The bulls see an acceleration bar late in the move. This could be more profit-taking.
- Although with the last bar having a large tail, if that was the profit taking, then this could be new bulls.
- Bulls that bought the close of the past week oinstantly made 1:1. So it was reasonable we would test this swing entry price again.
- Swing bulls want 2:1 with a breakout of the TR and MM up, likely after a tight bull channel.
- Bears have been selling highs for many months and see this as a double top, a reasonable buy signal high in a trading range to fade.
- But most traders will not trade it correctly and should look to trade in the direction of the bars and the moving average. Using reasonable stop entries.
- We are about a weekly bar range away from the moving average. Some traders wait for this and bet on regression back to the average price.
- Traders should also consider the 5+ reversals as breakout mode and the triangle. 50% of the time, the first breakout fails.
- Bulls have control over several bars now. So even though they don’t look great separately, together, it is likely by the close or buy above.
- Swings bulls will target the April highs.
- Expect sideways to up next week.
The Daily FTSE chart

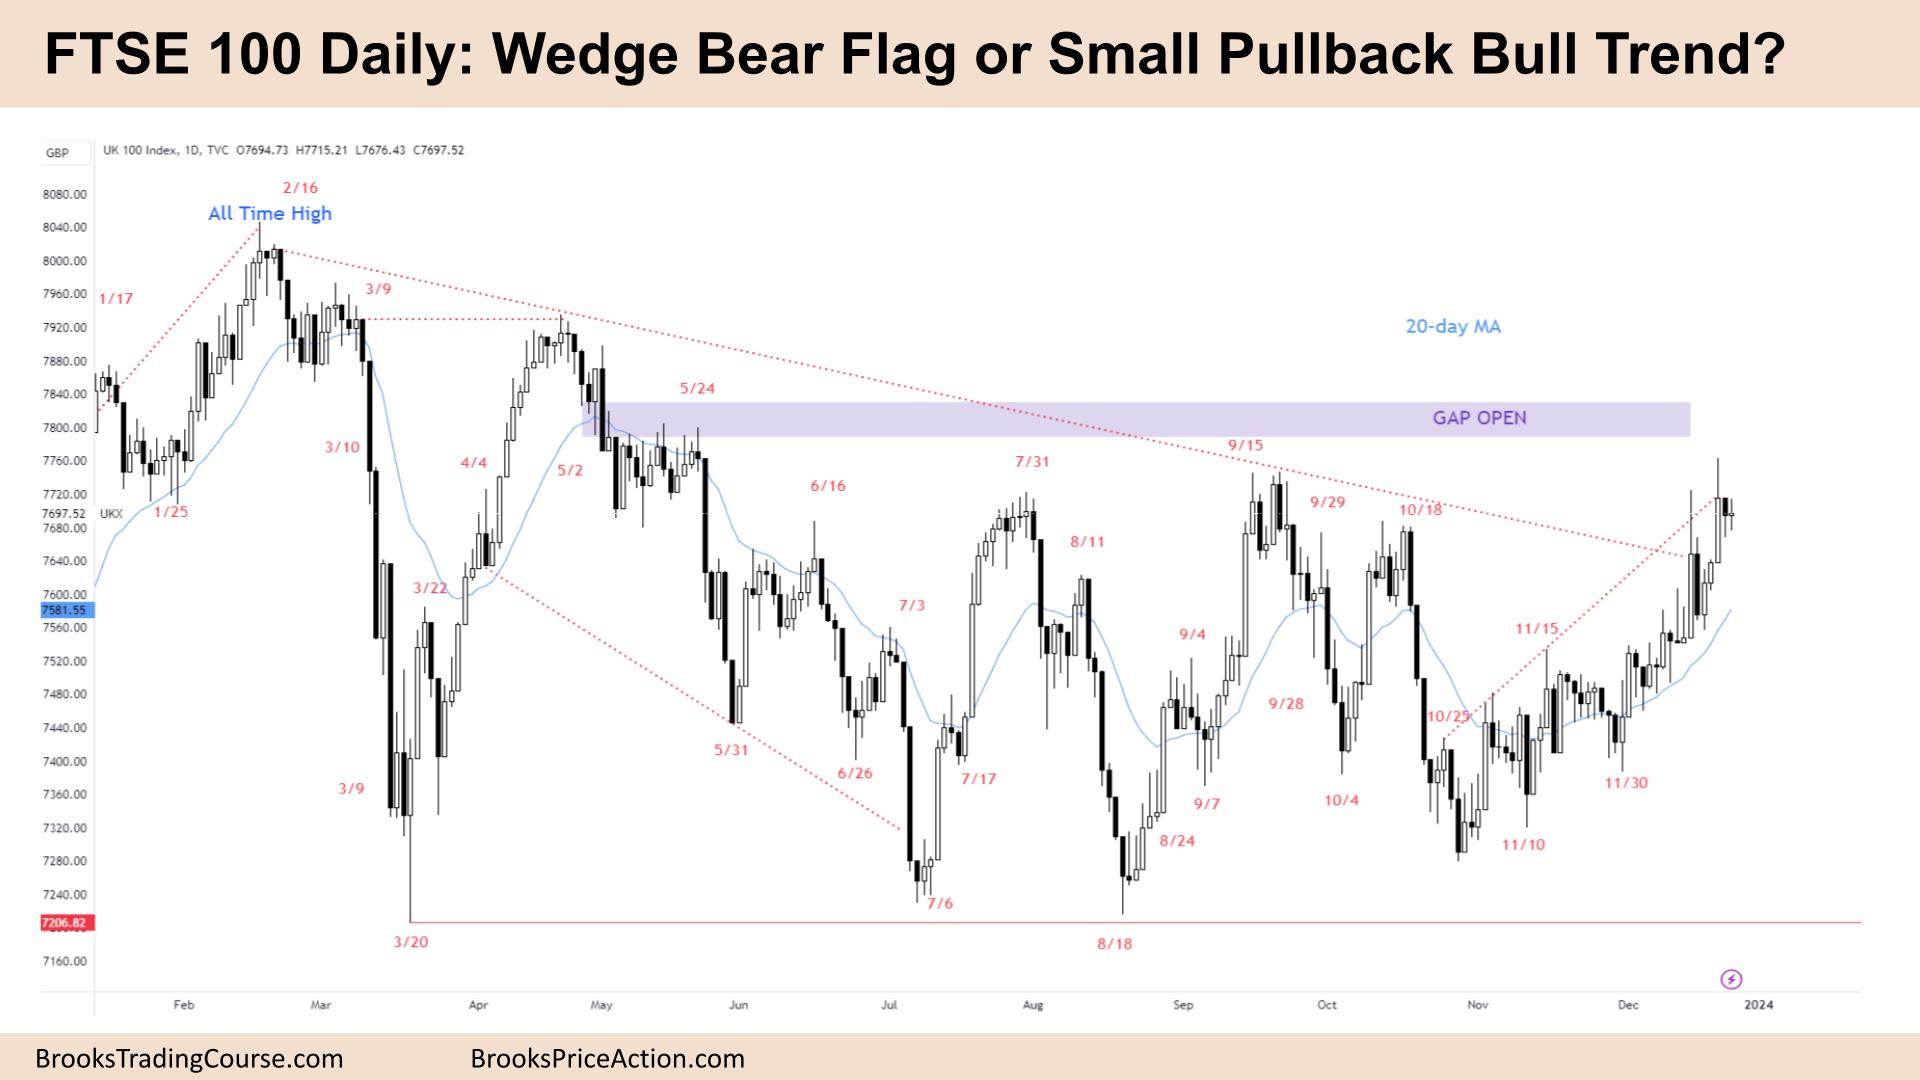
- The FTSE 100 futures went higher last week, closing with an ii, high in a trading range.
- The bulls have had several legs up in a small pullback bull trend. You can also call it a tight channel. Every bear bar was a buy.
- Traders expected to test the high of the last sell climax, which we did the week prior.
- Three bull bars in a row, tight bull channel, is very good for bulls.
- We hit the upper edge of the channel line, so we expected some profit-taking. But now, likely, there is another leg up.
- Some bulls will wait for a pullback to the MA. It has been about 15 bars above it.
- Limit order bears have been able to sell above everything, scale in, and make money. So, this is more likely a leg in a trading range than a breakout.
- Bulls need consecutive strong bull bars to convince bears to give up.
- We now have a good bull gap above the last inside bar. But ii is not a great buy signal. It is more likely a reversal signal for next week. But it is still better to be long than flat, so perhaps some bulls will buy, betting the bears don’t have anything yet.
- Bulls want to trap sellers below the bar and close the gap above. Which is common in a trading range.
- Expect sideways to down next week.
Market analysis reports archive
You can access all weekend reports on the Market Analysis page.

