Market Overview: FTSE 100 Futures
The FTSE futures market moved down last week with a small bear bar in a bear leg. We are pausing between the two MAs. Bulls want to buy on the moving average (MA), get another leg up, and close strongly above the prior All-time High (ATH). Bears are selling above bars back to where they got trapped before. The bear leg down was strong, and they wanted a second leg. The second leg can often have 3 pushes like we are forming here and then become a DB.
FTSE 100 Futures
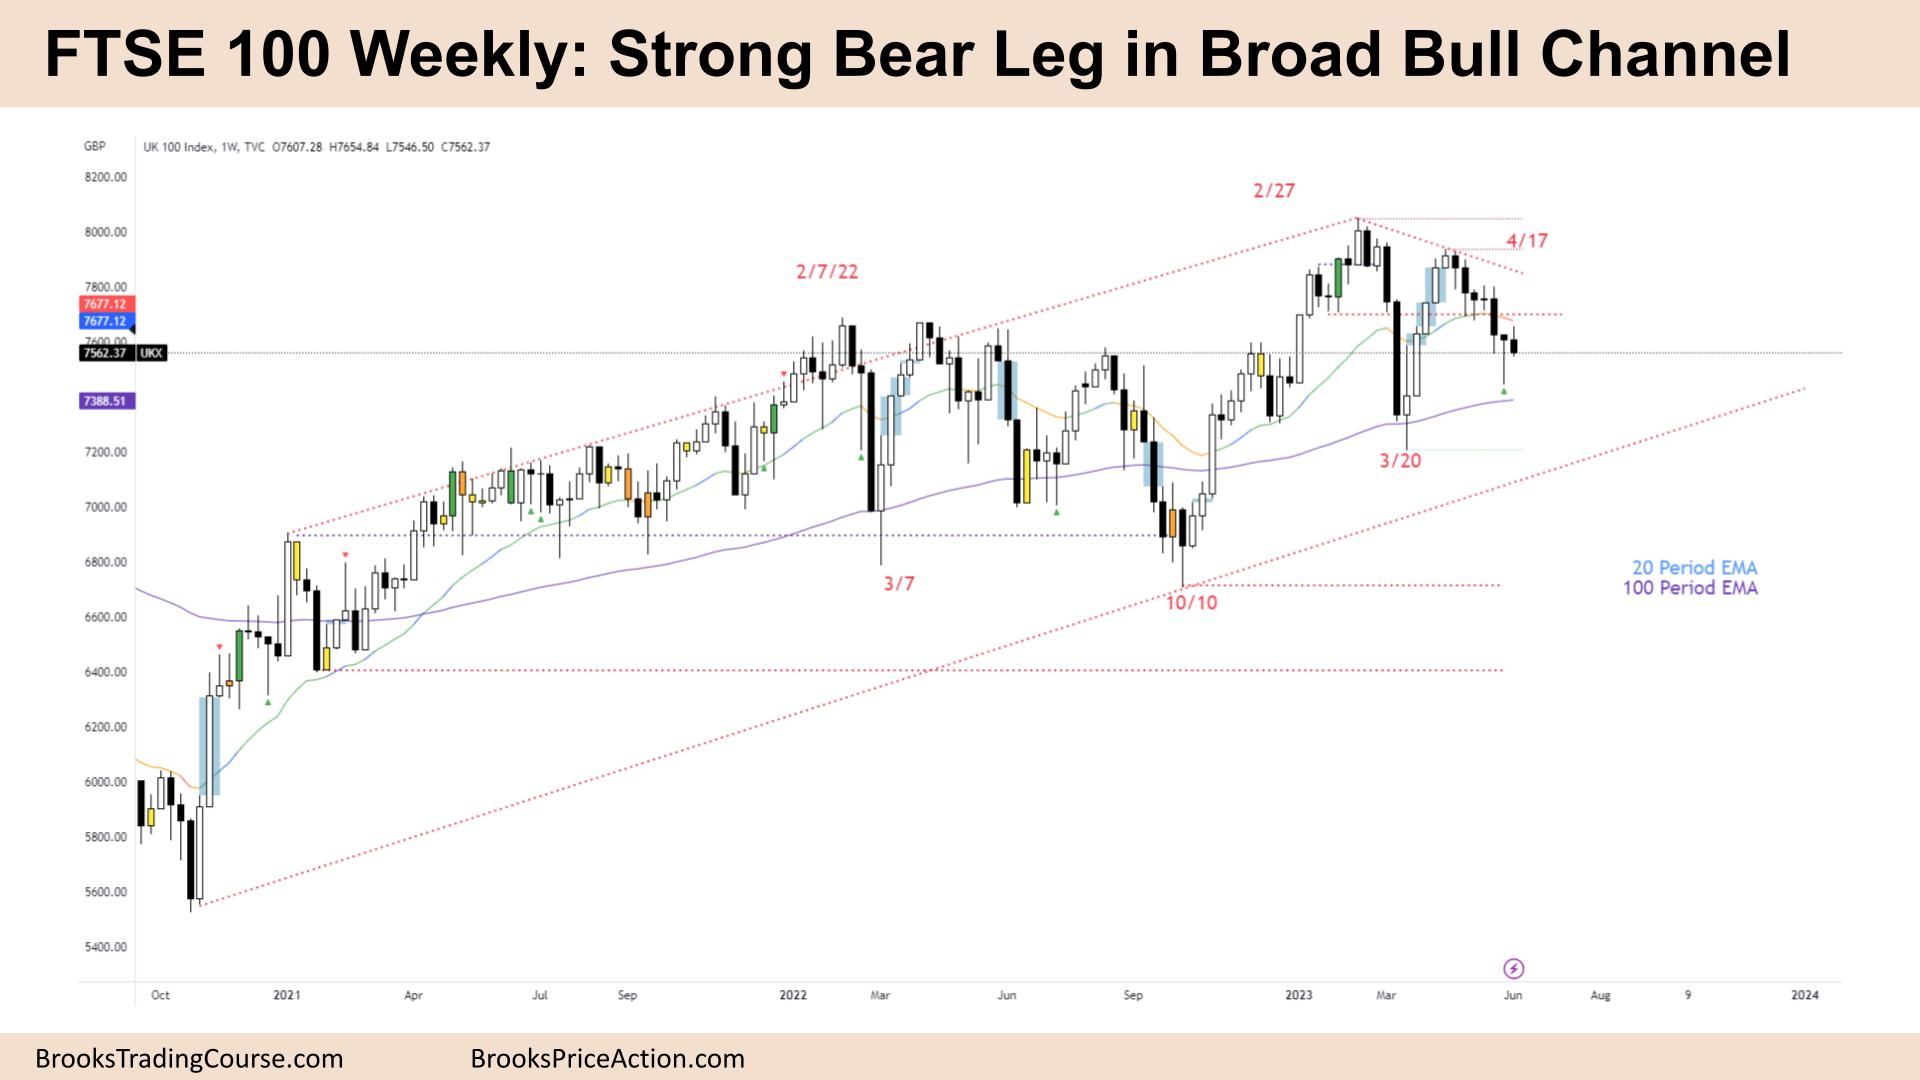
The Weekly FTSE chart

- The FTSE 100 futures was a small bear bar in a bear leg closing on its low so that we might gap down on Monday.
- It is the eighth consecutive bear bar which is unusually strong and likely climactic.
- How many sets of eight bear bars do you see to the left? Zero. We might be seeing a change in the rhythm of the market.
- It was a High 2 buy above the prior week, but because last week was a reversal bar but still a bear bar, it was a low probability to buy it.
- The bulls see a deep pullback from October. It is a HTF High 2 but without a buy signal in a bear leg.
- It is the second volatility contraction, we might be forming a parabolic wedge but need one more move down first.
- We have a LH and HL, so a type of triangle and traders are looking for evidence of the next more.
- The bears see the attempt at the High 2 failed, and now it might act as resistance above. The MA should have been a good buy entry in a bull trend but also failed.
- When the price crosses, the MA typically spends 4 – 5 bars there. When it does not, traders get stuck.
- Bears see consecutive bars below the MA, and we are probably always in short.
- Big up, Big Down, Big confusion. Traders should be buying low and selling high.
- If you sell here, where is your stop? April 17th. You would need a big move to get 1:1 which is unlikely.
- If you buy here, what are you buying, and where is your stop? No stop order buys; there is a limit buy at the 100-week MA. It is a magnet, and we might race down there.
- Bulls have made money for 2 years buying the 100-week MA – so there will be buyers down there again.
- The prior week had a big tail, so a 50% entry of that tail is a reasonable buy, and a limit buy below that bar – because it is a bad stop order sell.
- The bulls still see a two-legged pullback from their strong leg starting on March 20th. But it is too many bars now. That is disappointing and there are probably sellers above.
- Next week, traders should expect sideways to down.
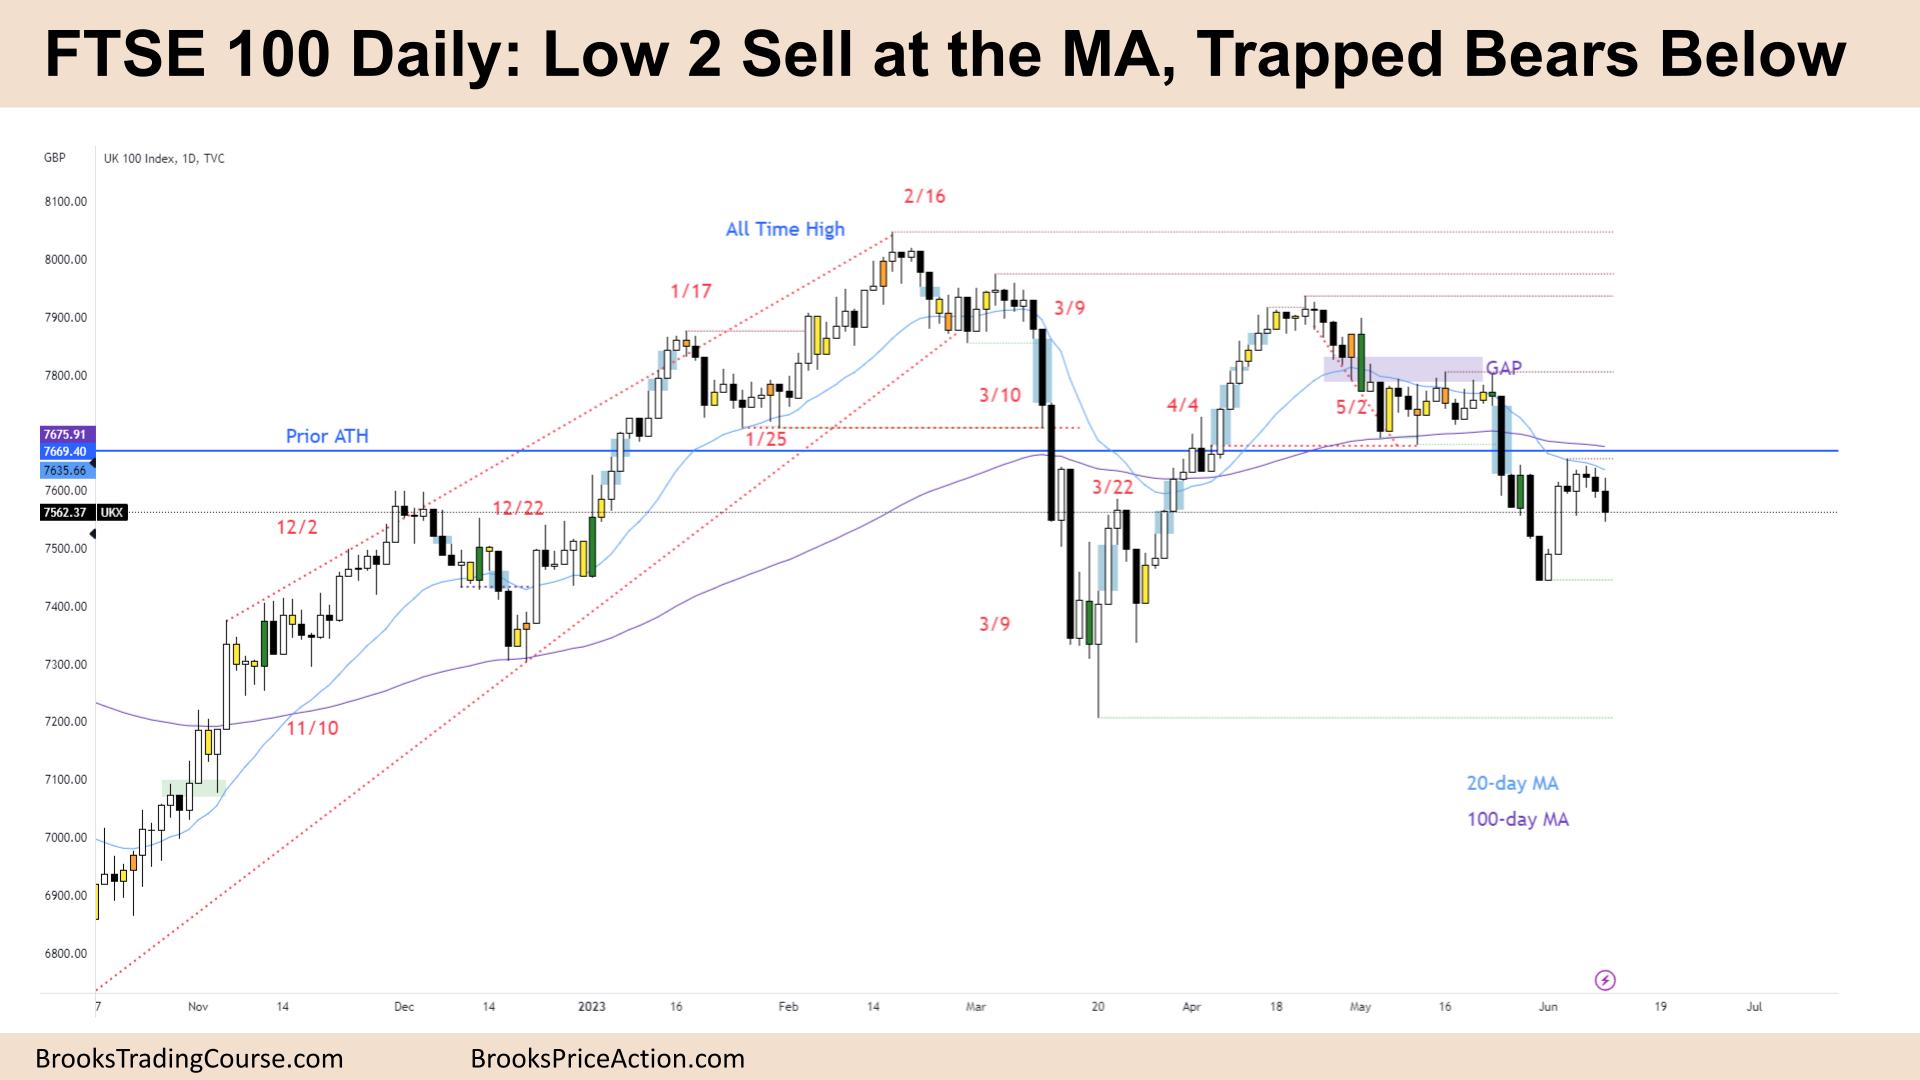
The Daily FTSE chart

- The FTSE 100 futures was a bear bar closing near its low in a bear leg.
- It is the third consecutive bear bar below the MA, so we are likely always in short.
- Bulls see a higher low double bottom with March, in a broad bull channel on a higher timeframe.
- The bears see a lower-high double top and a major trend reversal.
- How can both sides have reasonable views? We are in a trading range.
- You might get out below Tuesday if you’re long from last week. Some bears will sell here with a target below.
- If you’re short, you sold the Low 2, then you already made one times the actual risk. Sometimes the market will pull back to the entry point shaking traders out before going to the target.
- If you’re flat, you can sell below Friday.
- There are now two open gaps above, so we expect to close those eventually.
- The bull bars to the left are strong and might have buyers at 50% and below the lows.
- Nothing to buy here.
- Price seems to be osciallating around the prior ATH which will then act as a magnet.
- There is also HTF 100-week MA below, which might pull us down first.
- Next week traders should expect sideways to down as the bear leg continues.
Market analysis reports archive
You can access all weekend reports on the Market Analysis page.

