Market Overview: FTSE 100 Futures
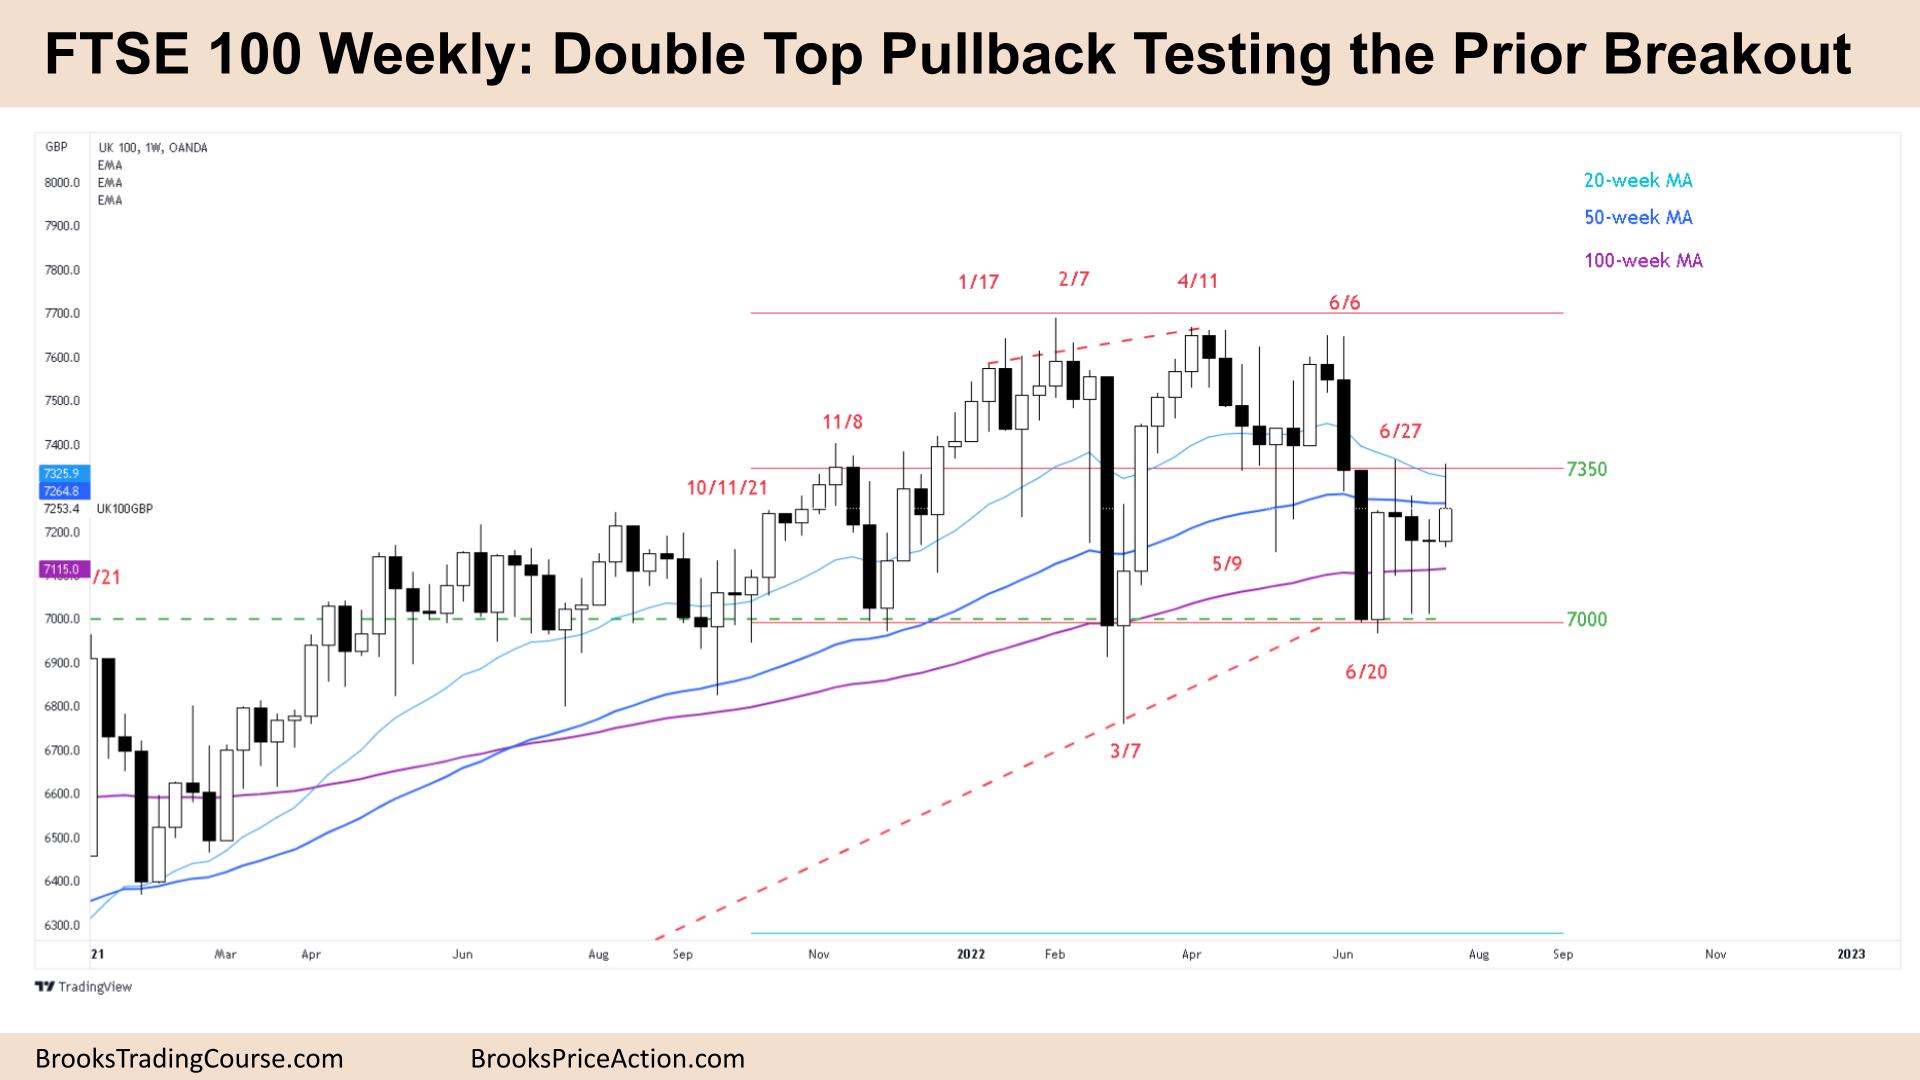
The FTSE futures market was a double top pullback testing the prior breakout. We have been going sideways for many weeks now so it’s a tight trading range ready to break out either way. The longer we go sideways the less steam the bears might have to push down further. The bulls will get above all the averages without having to buy above bars. The bears need a give-up bar to get this long-awaited second move down from June but we may have already had it.
FTSE 100 Futures
The Weekly FTSE chart

- The FTSE 100 futures was a bull bar with a large tail on top. It’s a double top pullback at the moving average.
- The bulls see a double bottom with June 20th, and micro double bottom with the prior 2 weeks. They see a possible major trend reversal and will look for a measured move up to the June highs.
- They see June as the second and final leg down from the major trend reversal above and looking to now continue long.
- As Al says, the computers are playing chess many moves ahead. They set up a close here so the measured move is exactly the highs of the range above.
- Even though it’s a bigger bull bar, it has a big tail and is not a great buy signal above last week – a failed High 2 in the middle of a trading range.
- The bears see a double top pullback at a prior breakout point for a second leg down. They expected a second leg after 3 consecutive big bear bars closing on their lows.
- They want a Low 2, sell signal around the moving average which is a higher probability sell for a continuation down to 7000. But a bull bar is a bad sell signal.
- The problem is the location, low in the 12-month trading range but high in the last few weeks of sideways price action. If you’re unsure, it’s a trading range with limit order trading so you should buy low sell high and scalp (BLSHS.).
- If you’re a bear do you sell above last week at the moving average? Or do you look at the barbwire tight trading range in May as a magnet and wait there to sell higher.
- If you sell the Low 2 you’re selling after 4 weeks of tails and reversals – there is probably more upside.
- I see the last 5 weeks as one inside bar of June 20th, so it’s a breakout and be ready for a move in either direction.
- If you had to be in, better to be short or flat on the sell below June 6th. Might sell more above last week on a failed High 2. Get out on consecutive bull bars.
- If you trade always in, you are flat looking for a new signal.
The Daily FTSE chart

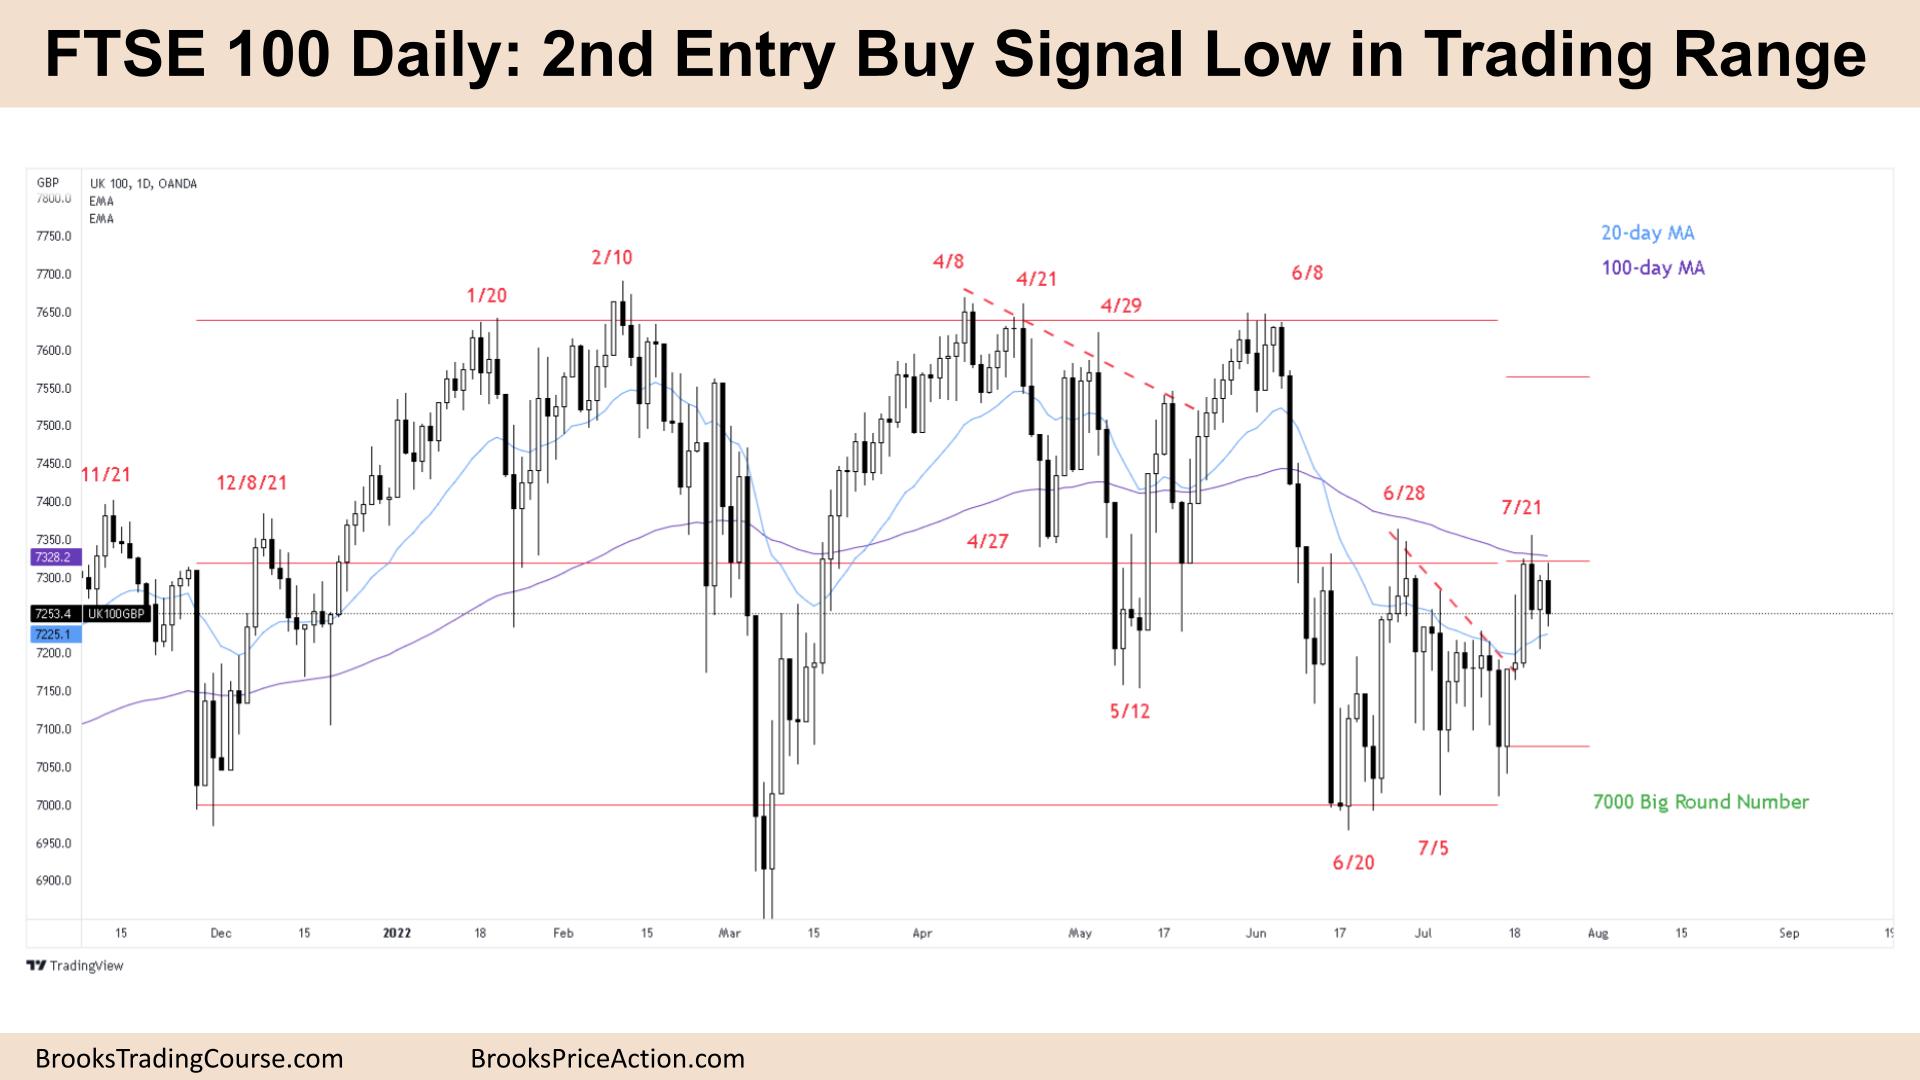
- The FTSE 100 futures was a small bear bar on Friday closing below the 100-day moving average (MA.)
- The bulls see a possible major trend reversal, a double bottom or wedge bottom buy setup. They see a trading range and a second entry long above last Friday’s bull bar closing on its highs.
- They also see a 3 consecutive bull bar spike and this is a pullback. But where is the follow-through?
- They want a High 2 or High 3 buy signal by trading above Friday but preferably Tuesday’s high for a measured move up near the June highs. If they can get a good close the bears might give up until higher.
- The location isn’t great in the middle of a trading range and you can see the limit order traders above and below. We might get more disappointment. Bad follow-through traps traders.
- The bears see a double top pullback from a strong bear spike down, they want to sell a Low 2 closing below Thursday’s tail.
- The bears want a second leg but we may have already had it.
- It’s a bad buy signal and a bad sell signal, so high in a trading range expect sideways to down until the bulls can break out.
Market analysis reports archive
You can access all weekend reports on the Market Analysis page.

