Market Overview: FTSE 100 Futures
The FTSE futures market moved lower again last week with FTSE 100 consecutive bear bars low in a trading range. We are back at the October 2021 breakout point and it makes you wonder if this is a failed breakout above the high. With bulls unwilling to buy they might need to go lower near the 7000 big round number. If they can get High 2 next week with a decent close we might see renewed buying interest.
FTSE 100 Futures
The Weekly FTSE chart

- The FTSE 100 futures weekly chart was consecutive bear bars, both doji pause bars, just below the 50-week moving average (MA) with a large tail below.
- We said last week that both bulls and bears would expect a second leg down after 3 consecutive large bear bars closing below their midpoints. We might be in or have completed that second leg.
- The bulls see a pullback from a High 1 off the bottom of a trading range with March 7th and the 7000 big round number. It’s a double bottom but not a great buy signal.
- The bulls want a second entry near the lows for a move higher. But trading ranges can often force bulls to be too high and bears to sell too low – you can see how frustrating it is for day traders to swing.
- Trading above this bar would be a decent High 2 for the bulls, but in the middle of the range is still 50/50.
- 7000 has been support for 18 months and was resistance long before that, so the market might stay around here while traders decide.
- We said last week even if the bulls got a follow-through bar, it is likely bears are selling above this week scaling in for a test of March lows. This remained true.
- Judging by the lack of buyers above last week’s close, they are likely down at 7000. Bears scalped out there as well. The bulls want either an inside bar and a High 2, or an outside up bar to force bears out of position.
- The bears see a possible failed breakout above the October 2021 high and would look for a measured move down to around 6800. This was a previous low on March 7th.
- The bears see a tight bear channel from a lower high major trend reversal. It’s a pullback and a Low 1, so it was a decent sell signal. It wasn’t a great entry bar with the tails and we can see they scalped out.
- It’s now 2 consecutive bear bars, even though they are dojis, which is another sell signal for next week.
- The bears might get a sell climax back to the lows or at last sideways to down.
- We said last week that if you look left, whenever we paused here on the weekly chart, we traded below and then finished higher as bears exited and bulls bought. So sideways to down next week again.
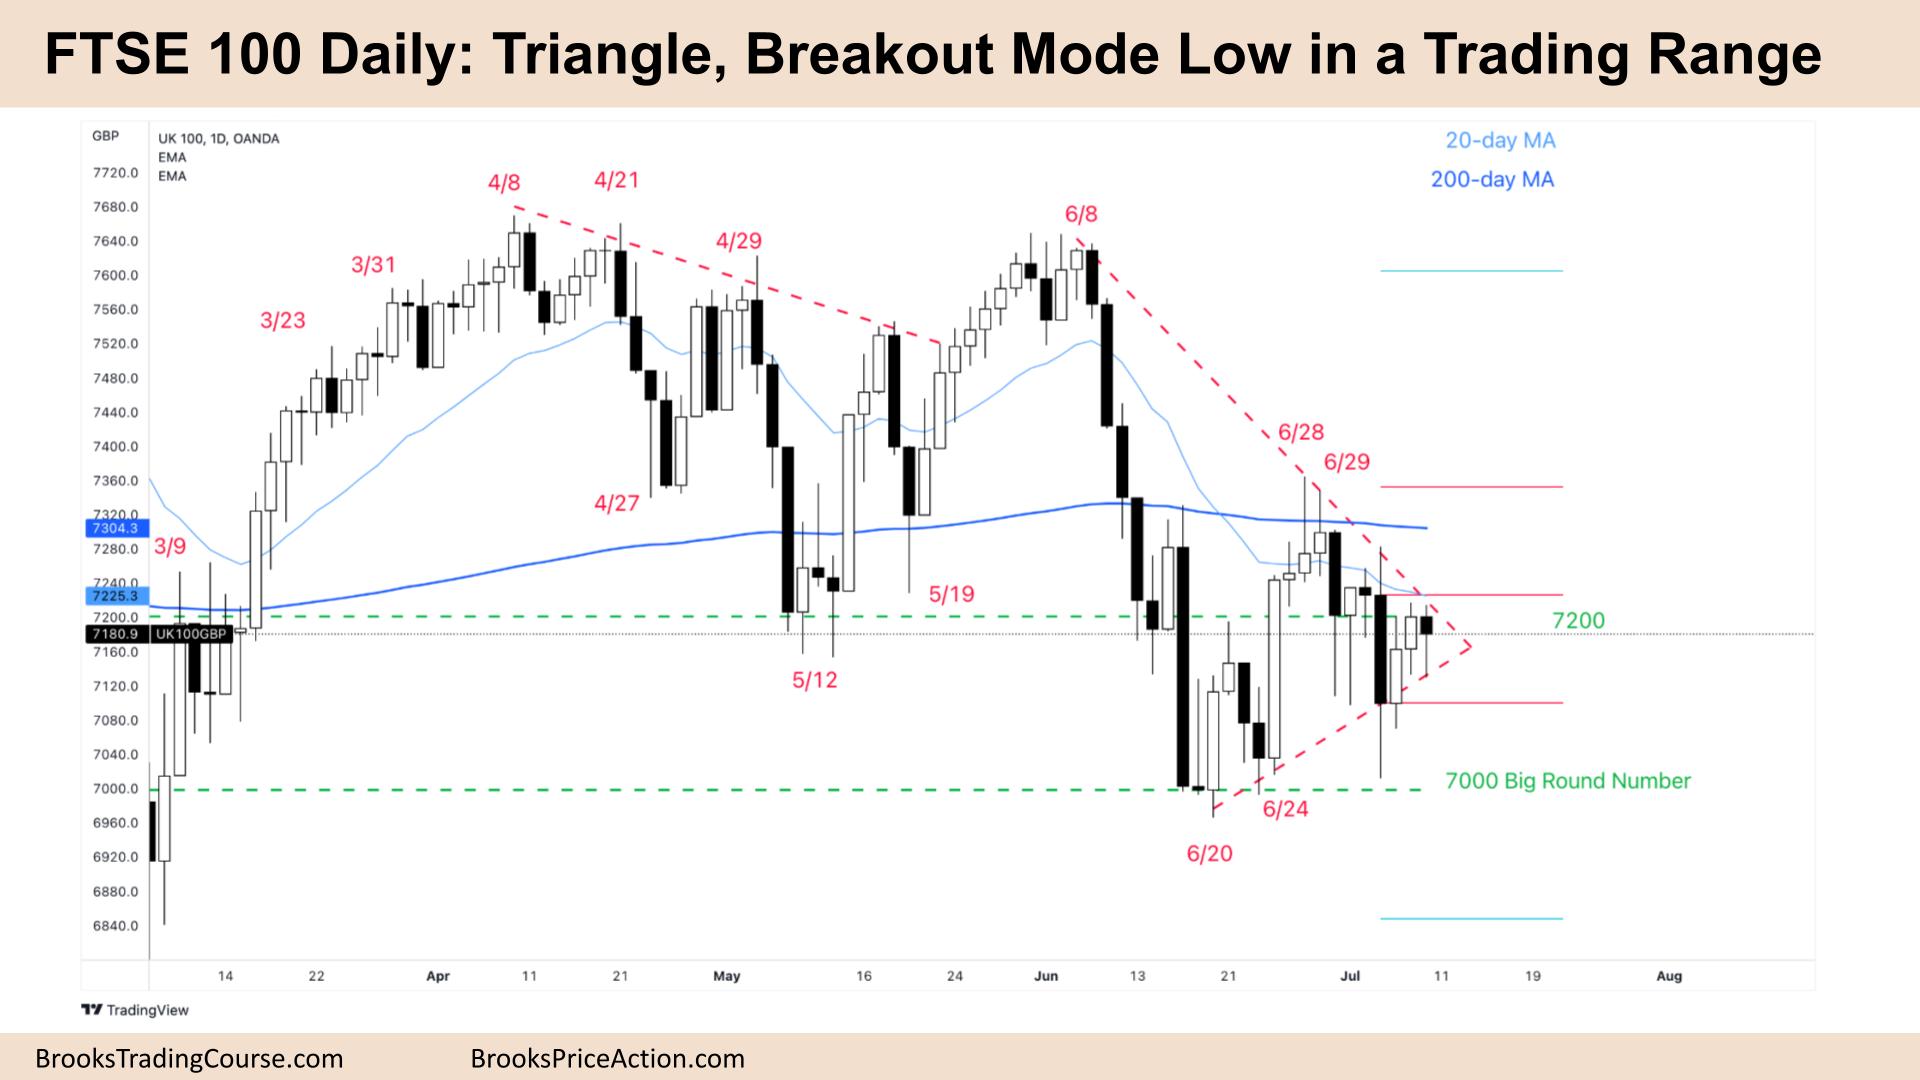
The Daily FTSE chart

- The FTSE 100 futures daily chart was a bear doji with a long tail below and a small tail above. It closed at the same point as Thursday but traded just slightly lower.
- The bulls see a triangle on a higher time frame and pause, pullback after 2 consecutive bull bars closing above their midpoints. It could be always in long on the buy above Thursday but if you’re long you probably wanted something better than Friday’s bar!
- The bulls see the sideways trading range since June 20th and counting the bull bars they think we are ready for a measured move up to the June 28th high of the range.
- But it’s a trading range and it looks bullish at the top and bearish at the bottom.
- The bulls need another bull bar closing above its midpoint preferably above the large bear bar close on Tuesday. They know it’s a tight trading range and 80% of breakouts fail. Tight trading ranges often have many failed breakouts before the right move.
- The bears see a Micro Double top Thursday/Friday, a pullback from 2 bear surprise bars last week in the top third of a trading range where their math is good. It’s not a great sell signal but limit bears will sell above Friday and higher looking to keep the bear trend on June intact.
- The bears know there has only been 1 bar in 30 days above the 20-day MA since June 8th. The last time was on June 29th which resulted in a sell climax. Any move up from here will likely get another sharp sell-off.
- The bears want a close below Friday and will sell a follow-through bar. If there is another large tail below they might give up and wait to sell at the moving average again.
- We will likely have similar trading next week, some brief rallies with a move lower again while bears decide how low they are willing to sell.
Market analysis reports archive
You can access all weekend reports on the Market Analysis page.

