Market Overview: FTSE 100 Futures
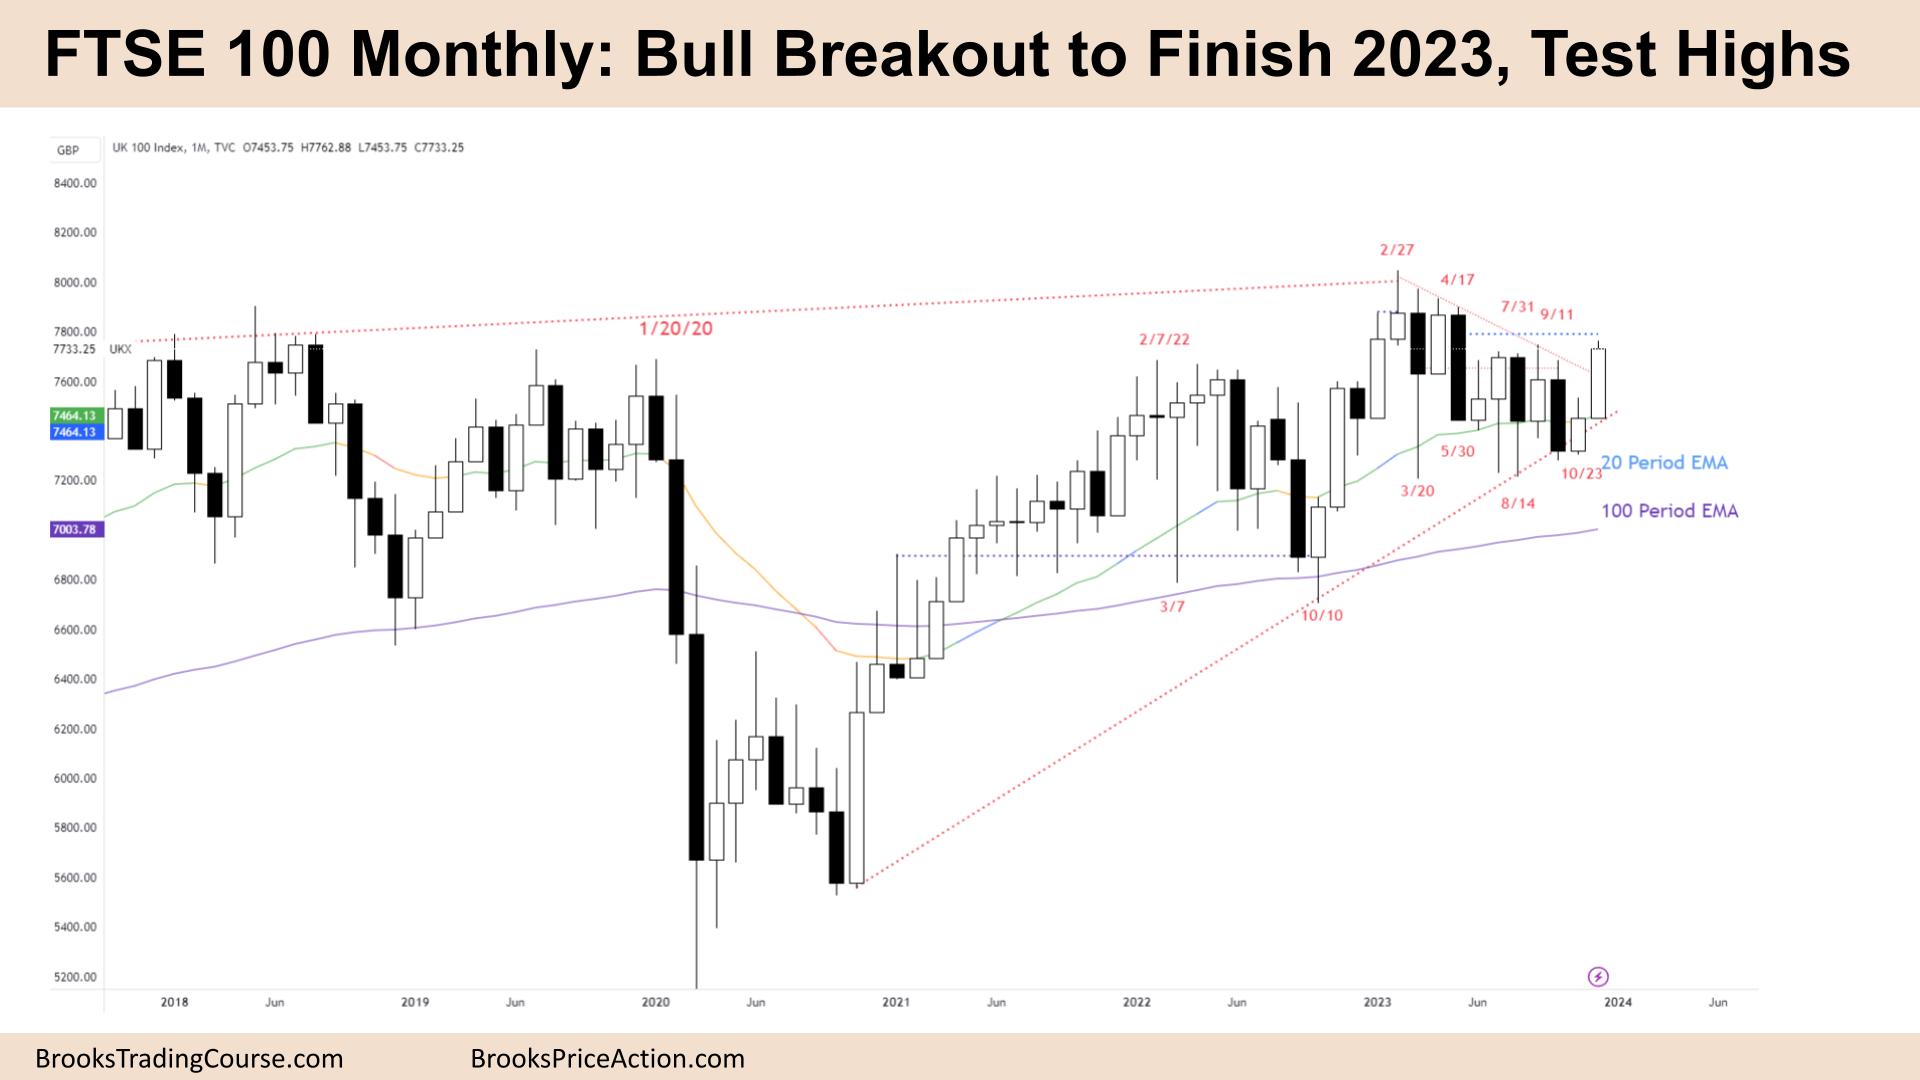
FTSE 100 futures moved higher last month with a bull breakout of a wedge bull flag to finish 2023. Bulls wanted a reasonable buy signal, but last month wasn’t it. Small bull bar closing below the MA – but it worked anyway. We might need to go sideways for bears to get out and other bulls to join in. The pain trade will be if it shoots higher as bears exit.
FTSE 100 Futures
The Monthly FTSE chart

- The FTSE 100 futures was a bull trend bar, a bull breakout to finish 2023.
- The bar closed near its high and far above the prior bull bar. So, there is an open breakout gap.
- The bulls see a High 2 or High 3, breaking out of a bull flag off a HTF trendline.
- The bulls want a pullback to keep the gap open or continuation next month to test the highest bull close.
- The bears see a HH DT, part of a possible head and shoulders top. They see a trading range and this is a pullback to create LH DT.
- More likely we go higher, considering we are above both moving averages.
- Bears will probably sell above May’s candle – a strong bear bar.
- Most traders should look for a swing trade. Consecutive bull bars above the moving average is a good choice.
- More likely, they can get at least 1:1 and, worst-case, scalp out at breakeven.
- Swings are 40% likely to go 2:1. That means 60% chance it does not. The bears see a trading range and will look to fade this bull breakout, but need a sell signal in the right place beforehand.
- The place for bears to scale in is just above 8000. So we could move up quickly to there.
- We have been in a triangle for many months. The first breakout often fails, and we go back and test it. Some traders will look to trade the weekly instead for better guidance.
- It was confusing because the prior month closed under the MA, so this follow-through is a surprise. We might pull back to attract more bulls.
- It is likely always in long; it is better to be long or flat. Expect sideways to up next month.
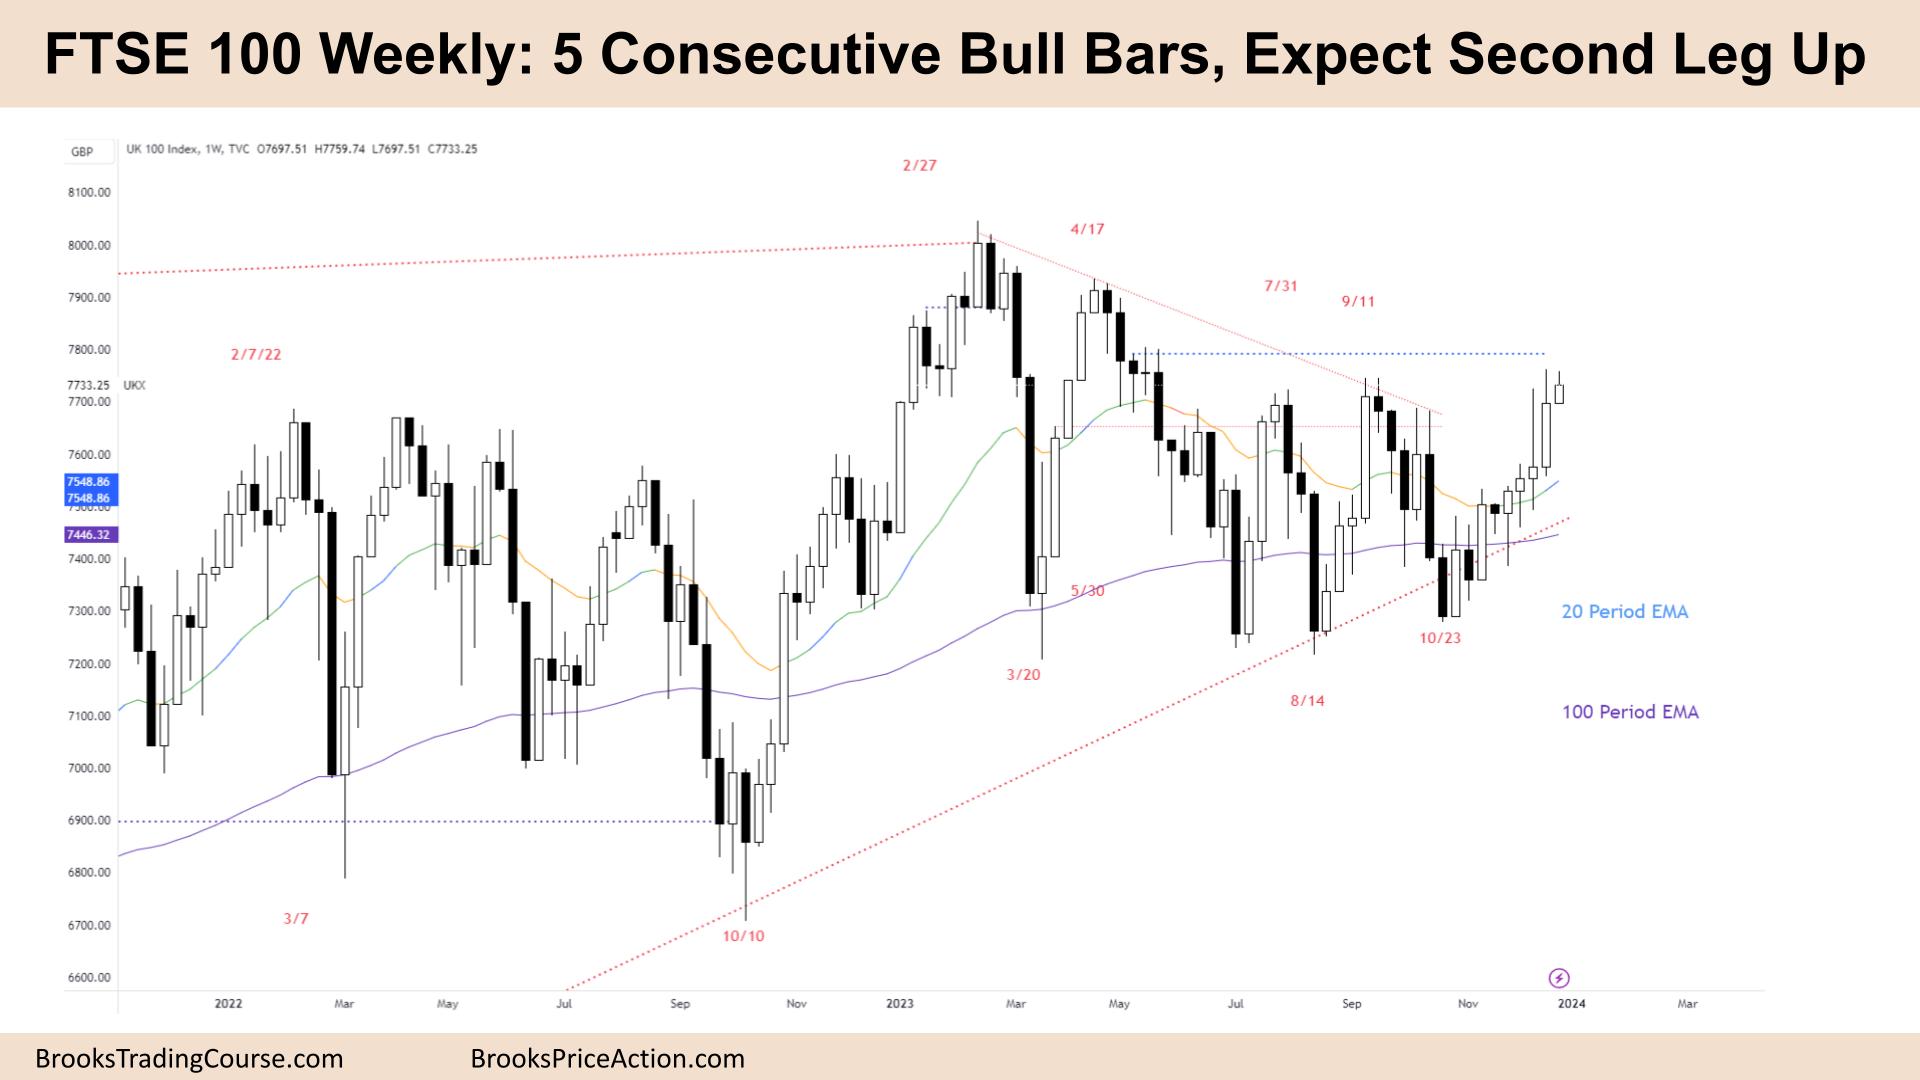
The Weekly FTSE chart

- The FTSE 100 futures was a small bull inside-bar last week.
- It is the fifth consecutive bull bar, so a tight channel and traders will expect a second leg sideways to up.
- The bar closed under the high of the prior bar. This usually happens at the edge of a channel, where bulls take profits at new highs and like to wait to buy lower.
- The bulls see a breakout above a double top and are looking for a measured move-up. That would take us to around 8000 and a new ATH.
- The bulls want a pullback into the range of the bar to attract new buyers. They want a bear reversal bar to be weak, fail, and get their second leg up.
- The bears see the trading range as a double top or a triple top. It has been in breakout mode (BOM) for many months, and most breakouts fail. They will be quick to get out if their fading does not work.
- Some bear scalpers already scalped. That was the big tail two weeks ago. But the follow-through has been surprising, so they wait for a good bear reversal bar to do it again.
- It is a 5-bar bull microchannel, and traders will expect buyers below the last two bull bars. The second last one is near the MA, which is likely a better place to get in if you are waiting for a pullback.
- It is always in long; it is better to be long or flat. Expect sideways to up next week.
Market analysis reports archive
You can access all weekend reports on the Market Analysis page.

