Market Overview: FTSE 100 Futures
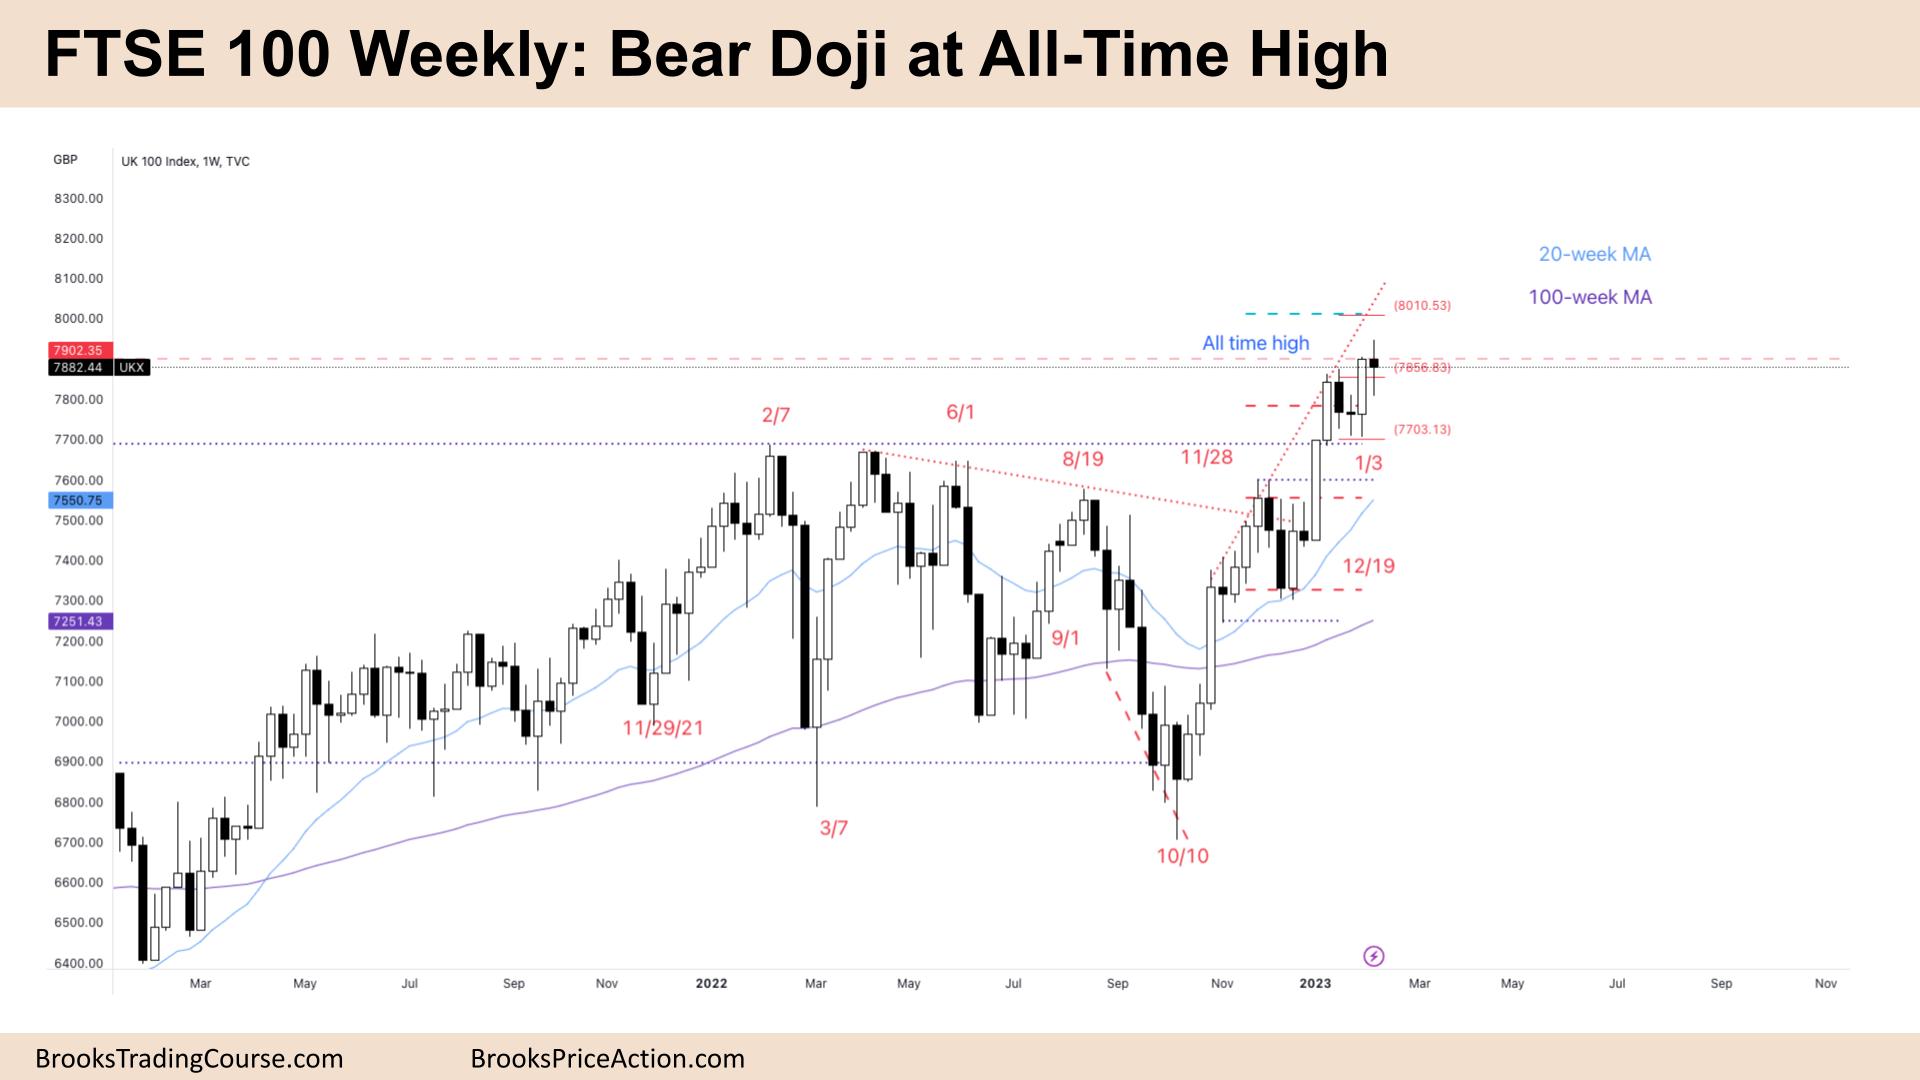
The FTSE futures market was a FTSE 100 bear doji at the All-Time High (ATH.) The bulls needed one more bar to confirm the breakout and follow-through but we went sideways instead. We are always in long but might need to go sideways here to find more buyers to go up. The bears are selling the ATH, and the prior high, and were able to push the price prior swing points to make money. As long as limit bears are making money, the trend is as strong as it could be.
FTSE 100 Futures
The Weekly FTSE chart

- The FTSE 100 futures was a bear doji at an All-Time high.
- It’s a pause bar in a tight bull channel. It’s neither a good buy nor sell this week.
- We are always in long – so better to be long or flat.
- The bulls see the pause bar as a pullback following a bull breakout – a test of the breakout point.
- The bulls want another bull bar to close above the breakout for confirmation to go long again.
- The bears see a higher high double top, a failed breakout above the previous trading range. They want a follow-through bar next week, so it becomes a reversal with follow-through, and they will look for a swing down.
- The bear doji two weeks ago was a bad buy signal, so traders expected to come back and test the high.
- Most traders agree this leg has had two pushes, and they are deciding if this is the final push.
- The acceleration away from the moving average is strong, so we might need to go sideways to down soon as bulls take profits. Hence the bear doji.
- There is a swing target and measured move above, so we might need to reach there, but we don’t have to go straight up. We might pull back and then have a final push-up.
- The limit bears have made money because the lows crossed prior swing points. If limit bears are making money, then limit bulls will also likely try to make money, buying below things which would further move us sideways.
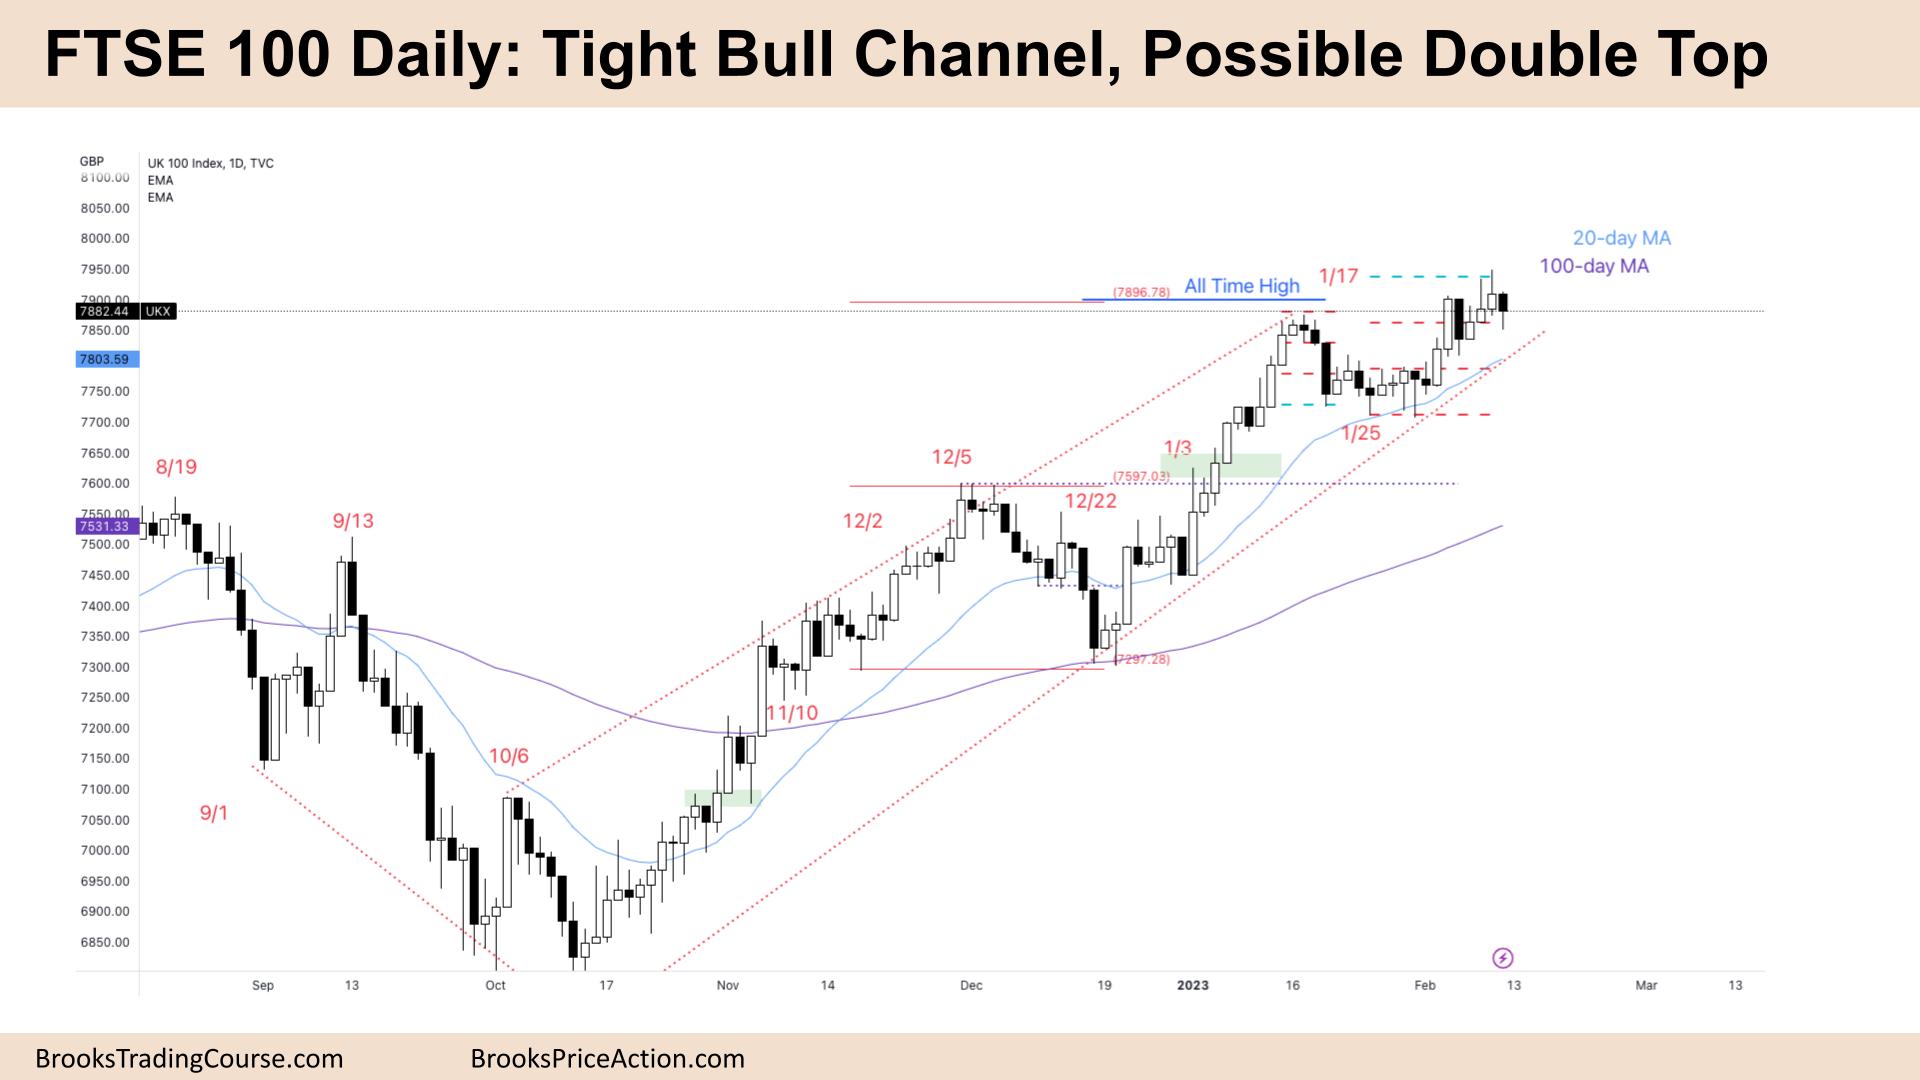
The Daily FTSE chart

- The FTSE 100 futures was a bear bar closing above its midpoint.
- It follows three small bull bars – two that had large tails.
- It dipped below the low of a prior bar in a bull micro channel, so some bulls bought there.
- Bulls see a tight channel and a breakout above the All-Time High. But the breakout lacked follow-through. They needed one more bar.
- The bulls reached their last swing target and will be looking for the next swing. But the move has likely had three legs already, so we might need two legs sideways to down before another swing sets up.
- The bears see a possible double top at the all-time high, and the lack of a strong close above the swing high is evidence of that.
- It’s confusing. Even though we are always in long, it is not easy to structure a trade here – so think trading range – BLSHS.
- Always in bulls did not exit below bear bars because the price did not trade below them. And some computers will see this week is technically a bull bar because it did not close below its midpoint.
- The bears need a decent bear bar to sell under, a second entry sell.
- The probability is not great, and the profit target isn’t either. At best the bears get to the trend line, or the moving average before going sideways.
- Expect sideways to up next week.
Market analysis reports archive
You can access all weekend reports on the Market Analysis page.

