Monthly S&P500 Emini futures candlestick chart:
Small doji after buy climax at resistance
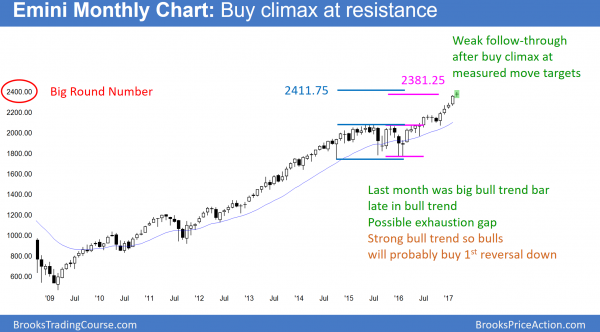
The monthly S&P500 Emini futures candlestick chart so far has a small doji bar this month.
The monthly S&P500 Emini futures candlestick chart had a big bull trend bar last month. This month’s doji is therefore bad follow-through buying. In addition, the monthly chart is at resistance created by the measured move projection from the 2 year Final Flag of 2014 – 2015. Furthermore, it is at the 2400 Big Round number.
Seasonally bullish but buy climax at resistance
There are 2 weeks left to the month. Hence, the chart could be very different once the month closes. Furthermore, the final 2 weeks of March are usually bullish. In addition, March and April are the strongest consecutive 2 months of the year. Finally, the Emini is in a strong bull trend. Hence, the bulls could create a big bull trend bar by the end of the month.
Yet, the resistance is strong. In addition, the rally is climactic, especially on the weekly chart. Therefore, the odds of a strong rally from here over the next couple of months are small. More likely, the monthly chart will pull back for a month or two.
Pullback more likely than reversal
Since the monthly chart is in a strong bull trend, the bulls will probably buy the 1st reversal down. The monthly chart could pull back for 1 – 3 months and still be in a strong bull trend. Because the bars on the monthly chart contain a lot of points, a 2 month pullback could be 150 points.
This is therefore enough to create a bear trend on the daily chart. Yet, it would still only be a bull flag on the monthly chart. Hence, the downside is not great for the next several months. The bears will probably need at least a micro double top before they can create a reversal on the monthly chart.
Weekly S&P500 Emini futures candlestick chart:
Far above moving average to pullback likely
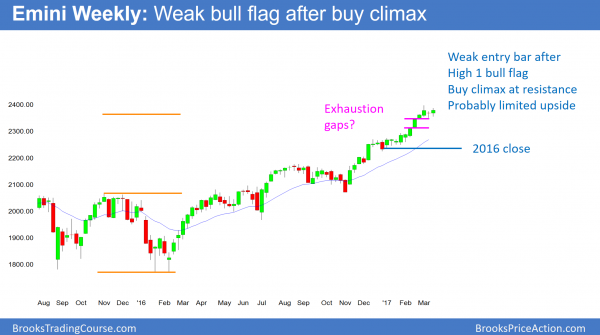
The weekly S&P500 Emini futures candlestick chart is in a bull trend, but it is far above the moving average.
The weekly S&P500 Emini futures candlestick chart’s high from two weeks ago is extremely far above the average price. When that happens, the odds are that the Emini will pull back to the moving average. Since the average is near the close of last year, which has not been tested, the odds are that a pullback to the moving average will probably fall to last year’s close.
Bull micro channel and buy climax
The weekly chart had a pullback below a 6 bar bull micro channel 2 weeks ago. Bulls usually buy that 1st pullback, and they did this time as well. Yet, they could only create a doji bar. Hence, that is a weak buy signal bar.
The measured move targets up from the 2 year Final Bull Flag are major resistance. Nine consecutive bull bars is extreme and therefore a buy climax. When there is a High 1 bull flag after a buy climax at resistance, the odds are that the rally will not last more than a few bars. While this week was the entry bar for the breakout above the bull flag, the odds are that the rally will not go far.
In addition, when there is a bear breakout below a bull micro channel, and the trend is climactic, the trend resumption up usually only lasts 1 – 3 bars before there is a bigger pullback. This therefore means that the weekly chart will probably begin to correct within the next 2 weeks.
Minor reversal likely
Because the weekly chart is in a tight bull channel, the odds are that the 1st reversal down will be minor. Even if the bears correct down to the December close, the bulls will probably buy the selloff.
When a bull trend is in a tight channel, like the yearlong rally, the bears usually need a major trend reversal before they can create a bear trend. Hence, the bears need a strong selloff. Furthermore, they need to see the bulls buy the strong selloff, but fail to break strongly above the old high. The rally would therefore create a double top. That failed rally then would be a major trend reversal. Hence, the best the bears probably can get over the next few months is a deep pullback and a trading range, not a bear trend.
Because even unlikely things happen at least 30 – 40% of the time, the bears have a chance of a major reversal that begins as a minor one. Yet, the odds are against it.
Daily S&P500 Emini futures candlestick chart:
FOMC Fed interest rate hike will lead to 5% correction
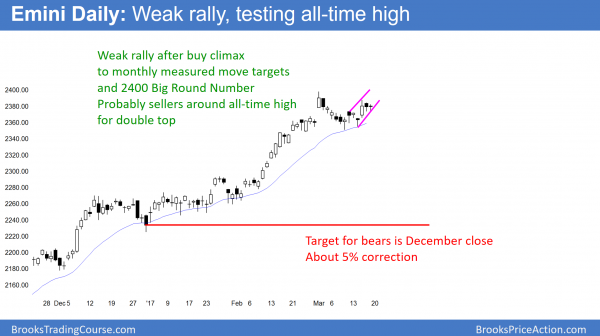
The daily S&P500 Emini futures candlestick chart is in a 3 week trading range after a buy climax to monthly measured move targets.
The daily S&P500 Emini futures candlestick chart has been in a tight trading range for 3 weeks. While the bulls want a strong break above 2400, that is unlikely because of the buy climax on the weekly chart. Yet, the bears do not yet have a top. However, when there is a tight trading range after a buy climax, traders watch for a small double top. Hence, if the bears create a small double top or wedge top within this range, especially of there is a good sell signal bar, traders will sell.
This is because traders know how extreme the buy climax is, especially on the weekly chart. They therefore expect a correction. In addition, the Emini never tested last year’s close. Because that is unusual, there is a 70% chance of the test at some point this year. Furthermore, there is a 60% chance that it will happen within the next 2 months. This is because the buy climax is now at major resistance. The December close is also below of Dow 20,000. A pullback to that close would therefore be a test of the breakout above the Big Round Number.
Traders can see the end of the day bar-by-bar price action report by signing up for free at BrooksPriceAction.com. I talk about the detailed Emini price action real-time throughout the day in the BrooksPriceAction.com trading room. We offer a 2 day free trial.
When I mention time, it is USA Pacific Standard Time (the Emini day session opens at 6:30 am PST, and closes at 1:15 pm PST). You can read background information on the intraday market reports on the Intraday Market Update page.


