Market Overview: EURUSD Forex
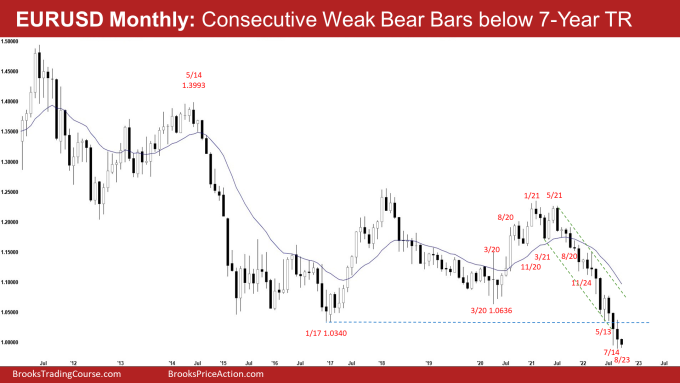
The EURUSD Forex monthly candlestick was a consecutive bear bar, below 7-year trading range low. The long tails below July and August candlesticks indicate that the bears are not as strong as they could have been. Bears want a breakout below the 7-year trading range low followed by a measured move down based on the height of the 7-year trading range which will take them to the year 2000 low. The bulls want a reversal up from a trend channel line overshoot and parabolic wedge (November 24, May 13 and August 23).
EURUSD Forex market
The Monthly EURUSD Forex chart

- The August Monthly EURUSD candlestick was a bear bar with tails above and below.
- Last month, we said that the selling was climactic. The trend channel line overshoot and wedge bottom (November 24, May 13 and July 14) increase the odds of at least a small sideways to up pullback (for a couple of weeks) before the EURUSD continues lower. The pullback may have begun in July.
- The EURUSD traded sideways to up for another 2 weeks in August before moving lower.
- The long tails below July and August candlesticks indicate that the bears are not as strong as they could have been.
- The bulls want a failed breakout from the 7-year trading range low. They want a reversal up from a trend channel line overshoot and parabolic wedge (November 24, May 13 and August 23).
- However, the bulls have not been able to create strong consecutive bull bars since the selloff in 2021.
- Bears want a breakout below the 7-year trading range low, followed by a measured move down based on the height of the 7-year trading range, which will take them to the year 2000 low.
- The selloff since June 2021 is in a tight bear channel. That means persistent selling and strong bears.
- We said that the bears will need to create a consecutive bears bar to confirm the breakout below the 7-year trading range. They got that in August.
- While August traded below July, it closed above its low. September so far is an inside bear bar.
- For now, odds slightly favor sideways to down.
- If September trades below August low, but closes with another long tail below, there would be a micro wedge (July, Aug, September).
- The selling has been climactic. The trend channel line overshoot and wedge bottom (November 24, May 13 and August 23) increase the odds of at least a small sideways to up pullback beginning within 1-3 months before the EURUSD continues lower.
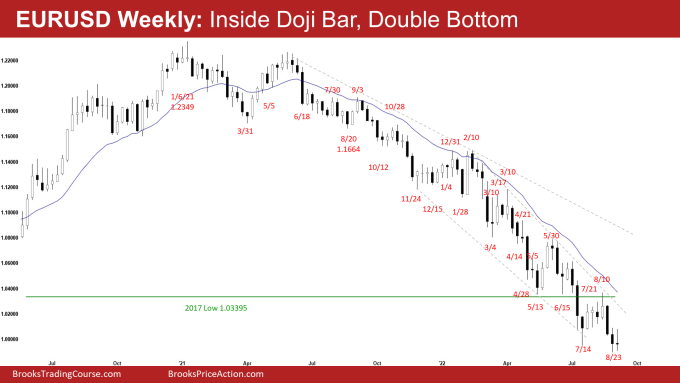
The Weekly EURUSD chart

- This week’s candlestick on the weekly EURUSD Forex chart was a bear doji bar.
- Last week, we said that the EURUSD slightly favors sideways to down. If the bears start getting strong consecutive bear bars closing below July low, odds of a breakout, and a measured move down increase. But if the next couple of weeks trades lower, and reverse to close as bull bars, or overlapping weak bear bars with long tails below, we may start to see another reversal attempt from the bulls.
- The bears want a strong breakout below the 2017 low, and a measured move down based on the height of the 7-year trading range. This will take them to the year 2000 low.
- The move down is in a tight bear channel. That means strong bears.
- The bears got the second leg sideways to down in August after the recent pullback.
- The bulls hope that the recent 4-week tight trading range pullback is the final flag of the move down which started in February 2022. They want a failed breakout below the 7-year trading range.
- They want a reversal higher from a wedge bottom (Mar 4, May 13 and July 14) and a double bottom with July low (July 14 and August 23).
- For now, the EURUSD slightly favor sideways to down.
- If the bears start getting strong consecutive bear bars closing below July low, odds of a breakout, and a measured move down increase.
- We have said that if the next couple of weeks trades lower, but reverse to close as bull bars, or overlapping weak bear bars with long tails below, we may start to see another reversal attempt from the bulls within a couple of weeks. This remains true.
Market analysis reports archive
You can access all weekend reports on the Market Analysis page.

