Monthly S&P500 Emini futures candlestick chart: Pullback in bull trend
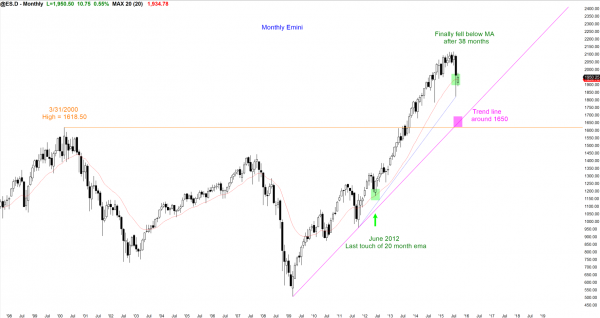
The monthly S&P500 Emini futures candlestick chart is holding support at the 20 month moving average
The monthly S&P500 Emini futures candlestick chart finally pulled back to its moving average after 38 months above the average. It found buyers there. Since 38 months is extreme, the bull trend is a type of buy climax. A buy climax is usually followed by at least 5 – 10 bars of sideways to down price action before the bulls will buy again. This means that the current pullback is a bull flag, but the flag might grow and last possibly a year before the bull trend resumes.
Weekly S&P500 Emini futures candlestick chart: Double bottom, but head and shoulders top likely
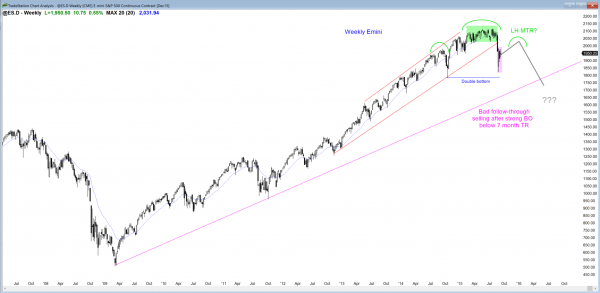
The weekly S&P500 Emini futures candlestick chart has been sideways for 3 weeks after a huge bear break below the bull channel. The follow-through selling has been bad for the bears and there is a 50% chance of a rally before the 2nd leg down begins. If there is a rally, the odds are that it will form a right shoulder of a head and shoulders top and it will be followed by a 2nd leg down.
The weekly S&P500 Emini futures candlestick chart had a strong bear break below a bull channel. The odds are that the bear breakout will have at least one more leg down. This means that whatever additional sideways to up bars that form on the candlestick chart will probably form a right shoulder of a head and shoulders top. This lower high major trend reversal has a 40% chance of a swing down on the weekly chart, but at least a 60% chance of a leg down within the trading range.
Every head and shoulders pattern is a trading range, and only about 40% of the good looking candlestick patterns are followed by a strong breakout and measured move. More likely, the trading range continues. If there is a bear breakout, the odds are that it will not go far. However, there is a 40% chance that the breakout will fall for a measured move down. Since the trading range is 300 point tall, if the measured move is based on the height of the trading range, the Emini might fall to 1500. This is unlikely because of the bull trend on the monthly chart.
More likely, the measured move will be a leg 1 = leg 2 measured move down. Leg 1 was about 300 points and it ended with the selloff 2 weeks ago. Although leg 2 might have started with this week’s micro double top, the odds are that the pullback from leg 1 will last for more bars (weeks), and it has a 50% chance of testing up to the bottom of the 7 month trading range. That is around 2050. If leg 2 then began there and it was also 300 points, like leg 1, the bottom of the selloff would be around 1750, which is just below the October low. That is a more likely outcome, and it has about a 50% chance of occurring, based on the price action at the moment.
Daily S&P500 Emini futures candlestick chart: Traders learning how to trade the markets see a pullback in bear trend
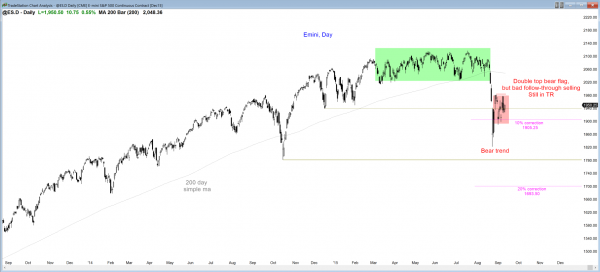
The daily S&P500 Emini futures candlestick chart had bad follow-through selling after turning down from a double top bear flag this week, and there is a 50% chance of a breakout above the bear flag before the bear trend resumes.
The daily S&P500 Emini futures candlestick chart is in a tight trading range after a huge bear breakout. It is in a bear trend and there is a 60% chance of a 2nd leg down. What is unclear is whether the 2nd leg down began with this week’s double top bear flag, or if the bear flag will break above this week’s double top bear flag and end at the bottom of the 7 month trading range at around 2050. Each possibility has about a 50% chance.
There is a 40% chance that the bull trend on the monthly chart is so strong that it is already in the process of resuming, and that the bear trend on the daily chart ended with the low 3 weeks ago. Most traders will not believe this until the Emini gets back up to a new all time high. Alternatively, traders will conclude that the bulls had taken control before going above the all-time high if the trading range grows to 20 – 30 or more bars and forms a strong bull candlestick pattern followed by a strong bull breakout of the pattern (but not yet a breakout of the all-time high).
Traders can see the end of the day bar-by-bar price action report by signing up for free at BrooksPriceAction.com. I talk about the detailed Emini price action real-time throughout the day in the BrooksPriceAction.com trading room, and a 2 day free trial is available.
When I mention time, it is USA Pacific Standard Time (the Emini day session opens at 6:30 am PST, and closes at 1:15 pm PST). You can read background information on the intraday market reports on the Intraday Market Update page.


