Monthly S&P500 Emini futures candlestick chart: 80% chance of 10% pullback this year
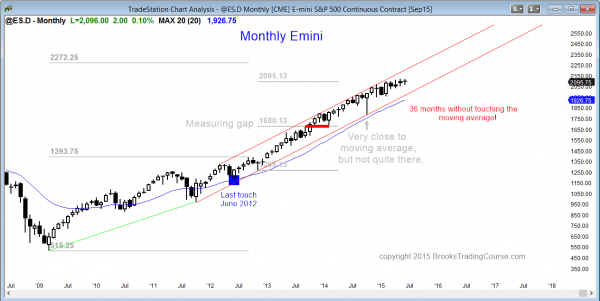
The monthly S&P500 Emini futures candlestick chart is extremely overbought, but there is no sign of a top. This month’s candlestick closes on Tuesday, and it might be a bear inside bar and therefore a sell signal bar.
The monthly S&P500 Emini futures candlestick chart is extremely overbought. This coming Wednesday is the start of the 37th month without touching the moving average. The 1998 rally lasted 44 months before having a 22% correction. The 1987 rally lasted one more month than the current rally, and then the stock market crashed 36%.
I do not believe that the stock market will crash, but I do believe that there is an 80% chance of at least 10% correction in the 2nd half of this year, and a 50% chance of a test of the October low, which is about 20% below the high. Although the small pullback bull trend is strong and it can go on for many more bars (months), the odds are against it. The slope of the bull trend is getting flatter, which means that the steep bull trend is starting to flatten. This is usually how a correction begins. However, until it has clearly begun, the bulls are still in control.
Weekly S&P500 Emini futures candlestick chart: Breakout mode
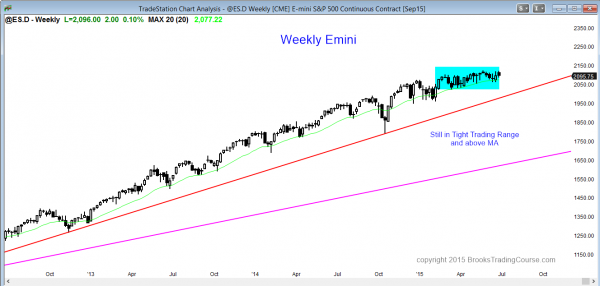
The weekly S&P500 Emini futures candlestick chart is in a 6 month tight trading range, but still above the moving average. The probability of a bull breakout is the same as for a bear breakout, but the bull breakout will probably fail.
The weekly S&P500 Emini futures candlestick chart is still in its 6 month tight trading range. If it has a bull breakout, it will probably fail within about 5 bars (weeks), and the tight trading range will be the final bull flag in an extremely overbought bull trend.
If there is a bear breakout, it could be steep and fast if there is a news event (like Greece defaulting), or it can be an endless pullback in a bull trend where there is no strong bear breakout. Instead, this could be a gentle bear channel. It would at first appear to be a bull flag, but it would then just keep drifting down. After about 20 bars (weeks), traders would then begin to view it as a bear trend instead of a bull flag. Once that happens, there is often a bear breakout that becomes a measuring gap, and is followed by a stronger bear trend. The bear breakout is a sign that the bulls have given up and that the bears have become much more confident.
Daily S&P500 Emini futures candlestick chart: Price action trading strategy for bearish candlestick pattern
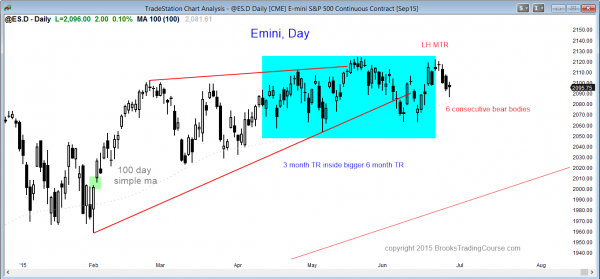
The daily S&P500 Emini futures candlestick chart is oversold over the past week, but 6 consecutive bear bars is a sign of selling pressure. This has not happened since January.
The daily S&P500 Emini futures candlestick chart is still in a 6 month trading range, but today is the 6th consecutive day with a bear body, and it follows 2 strong bear trend bars. The bears have not been this persistent since January, and it can be a sign of an impending bear breakout. Traders should be ready for a low probability event, like a gap down on Monday if Greece goes bankrupt this weekend or if some other totally unexpected event happens.
When a market is about to breakout, it often begins to trend before the breakout. The breakout can be to the upside as well, but I am going to talk about a bear breakout because that is what I believe we will get this year, whether or not there is a brief bull breakout first. The monthly chart is so unusually overbought and it is starting to bend over. We now have 6 consecutive bear bars on the daily chart. The Emini might be telling us that smart money is starting to sell more aggressively (sell out of longs, sell into shorts).
I remember in 1986, I bought some advertising on CBS radio for my surgical center. I noticed that crude oil prices were moving up quickly for several weeks, and the news mentioned it, but said no one knew why. When my ad ran during the next week, Reagan unexpectedly bombed Libya and crude oil soared…and I made about $50,000 from patients listening to CBS radio and then coming to me for eye surgery! The point is that when a market is in breakout mode, it often begins its new trend while still in the trading range, and it often does so with a series of 4 or more trend bars. We now have 6 bear bars.
Is this the start of the bear breakout? Who knows, but I have been doing this a long, long time, and I get suspicious when something unusual happens. I am not a conspiracy enthusiast, but I am pretty good at sensing when things are beginning to change. What is happening is consistent with a change. Sometimes there are false starts and this might be one. It probably is, like all of the other breakout attempts. But this is different from the rest and the stock market is about as overbought as it was in 1987, at least by one measure (the monthly moving average). Be ready!
Traders can see the end of the day bar-by-bar price action report by signing up for free at BrooksPriceAction.com. I talk about the detailed Emini price action real-time throughout the day in the BrooksPriceAction.com trading room, and a 2 day free trial is available.
When I mention time, it is USA Pacific Standard Time (the Emini day session opens at 6:30 am PST, and closes at 1:15 pm PST). You can read background information on the intraday market reports on the Intraday Market Update page.


