Monthly S&P500 Emini candle chart: Futures trading strategy is to be ready for a correction
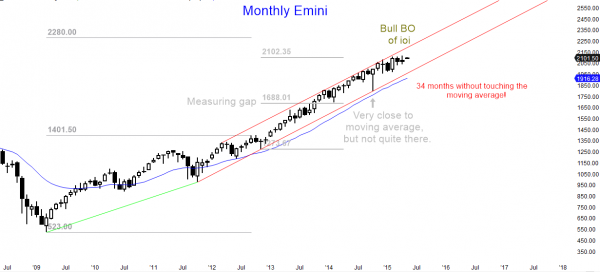
The price action of the monthly Emini candle chart is sideways in a 6 month tight trading range. The bull trend is extremely overbought and will probably correct down to the moving average this year. However, there is no top yet and it might go higher for several more months.
The monthly S&P500 Emini candle chart has not touched the moving average in 34 months, which has happened only twice in the past 50 years. The odds are high that it will correct down to it this year, and there is maybe a 50% chance of it falling to the October low.
What news will cause the correction? It is irrelevant. You cannot make money trading the news. The Emini futures and stock markets will fall simply because the consensus will suddenly switch to the idea that the rally has gone too far. Traders will change their swing trading strategy from the current approach of buying strength to a new approach of selling strength and buying weakness.
This has not yet happened, but with the monthly chart as overbought as it is, the change will probably happen at any time in the next few months. Until then the monthly chart is still in a small pullback bull trend, which is the strongest type of bull trend. It is also in a 6 month tight trading range, which might become the final bull flag before the correction.
Weekly S&P500 Emini candle chart: Swing traders are still buying
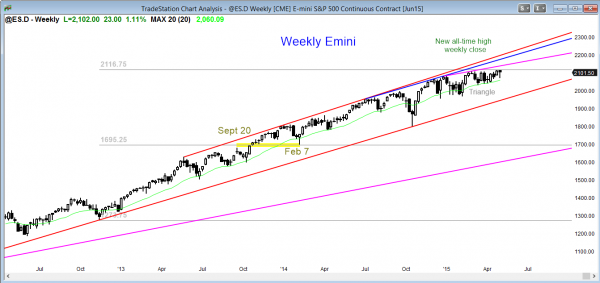
The price action trading strategy for the weekly Emini candle chart is to look for a breakout or a failed breakout of this 3 month trading range. Even though the Emini futures contract is in a bull trend, it is very overbought, and a tight trading range late in a trend is often the final bull flag.
The weekly S&P500 Emini candle chart formed an outside bar this week, but it rallied today back above its midpoint. The bears failed to close this week below last week’s low. This increases the chances that last week’s breakout above the 3 month trading range might still be successful. However, a tight trading range late in a trend is likely the final bull flag than a base that will lead to another strong leg up.
Daily S&P500 Emini candle chart: Price action trading strategy is to be ready for a breakout of the ascending triangle
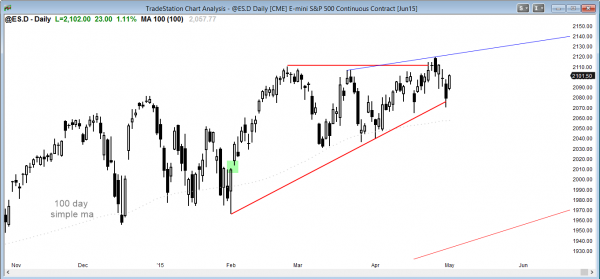
The daily S&P500 Emini candle chart is in an ascending triangle, and the odds favor a bull breakout.
A triangle late in a bull trend is usually the final flag before a correction. Also, if the current 2 day rally fails to break out to a new all-time high, it will form a lower high. On the 60 minute chart, this would be a lower high major trend reversal (head and shoulders top). Traders learning how to trade the markets should realize that most tops are more likely to be bull flags than reversal patterns. However, with the S&P Emini as overbought as it is on the monthly chart, the odds are increasing that reversal will finally lead to a swing trade down. There have been many tops in the past few years, and every one became a bull flag. The odds are that this one will as well. If it does, traders still need to be looking for a top because the monthly chart is so overbought and likely to correct at least 10% this year.
Forex trading strategies: Look for a pullback in the Euro on the 60 minute chart next week
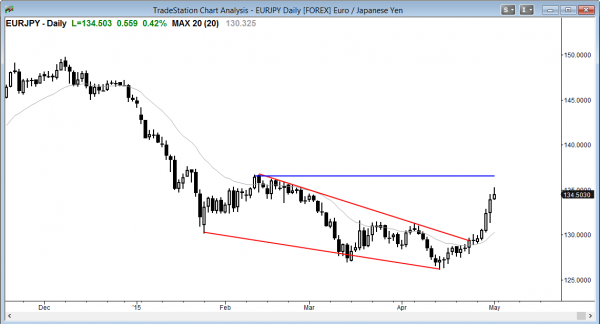
The daily EURJPY Forex candlestick chart had a strong breakout above a wedge bottom. The odds favor a pullback and then a 2nd leg sideways to up to test the top of the wedge bear channel (blue line).
The daily chart of the EURJPY has a strong breakout above a wedge bottom. The Forex trading strategy is to buy a pullback for a 2nd leg sideways to up. Since the rally has been climactic, the pullback might be deep (around 50%) and last for more bars than traders would like. However, a 2nd leg up after the wedge bottom is more likely than a resumption of the bear trend.
The EURUSD rally this week has a series of buy climaxes on the 5 and 60 minute candlestick charts, which creates a wedge top variation, and it will therefore probably correct down and enter a trading range early next week. Traders will begin to look to sell new highs, in addition to buying pullbacks.
Traders can see the end of the day bar-by-bar price action report by signing up for free at BrooksPriceAction.com. I talk about the detailed Emini price action real-time throughout the day in the BrooksPriceAction.com trading room, and a 2 day free trial is available.
When I mention time, it is USA Pacific Standard Time (the Emini day session opens at 6:30 am PST, and closes at 1:15 pm PST). You can read background information on the intraday market reports on the Intraday Market Update page.


