Monthly S&P500 Emini futures candlestick chart: Small breakout to new all-time high
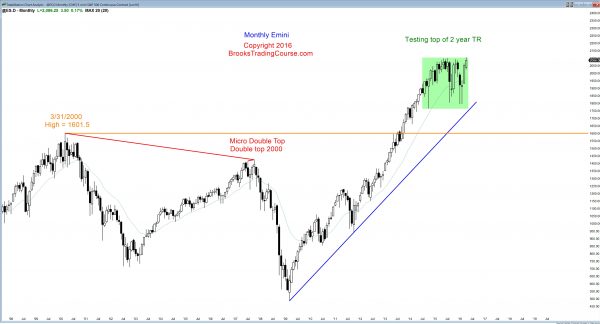
The monthly S&P500 Emini futures candlestick chart broke to a new all-time high this week, but pulled back. There is still a week left to the month. The month could become a big bull trend bar or a bear reversal bar. It probably will be something in between.
The monthly S&P500 Emini futures candlestick chart broke above its 2 year trading range. The breakout is not yet big. In the final week of the month, the candlestick pattern could look very different from how it looks today. If there is a strong rally, this month’s bull trend bar could become very big. If so, it would increase the chances of higher prices over the next few weeks.
The Emini might also reverse down to below the open of the month. April would then be a sell signal bar for May. However, the March bar was so big that there probably will be buyers below April’s low, even if April is a bearish candlestick pattern when the month closes.
Until there is a bull strong breakout with strong follow-through, the odds are that the current breakout will be limited, and it will only slightly increase the height of the trading range.
If there is a strong breakout, it will probably fail within about 5 bars (months), and the 2 year trading range would then be the Final Bull Flag in the 7 year bull trend. There is a 60% chance of a 20% reversal beginning some time this year, whether or not there is a strong bull breakout first. That is what usually (60%) happens in a buy climax.
Weekly S&P500 Emini futures candlestick chart: 11 weeks without pullback so buy climax
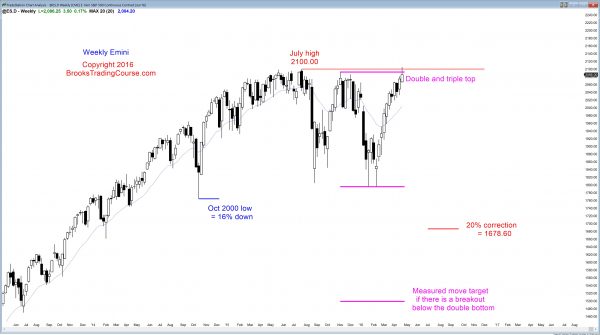
The weekly S&P500 Emini futures candlestick chart added an 11th week to the bull micro channel. This is unusual and therefore unsustainable and climactic.
The weekly S&P500 Emini futures candlestick chart has an 11 bar bull micro channel. That means that the low of every week is above the low of the prior week, which means that there was no pullback in 11 weeks.
If you scroll back over the past 10 years, you will see many micro channels that have lasted 7 – 10 bars. I only saw one that lasted 11 bars and one other that lasted 12 bars. I did not see any that lasted more than 12 bars. That tells traders that the odds of the current one lasting much longer are small.
Even though a micro channel that lasts 10 bars is climatic, it is also a sign of strong buying. Bulls are not not waiting to buy a dip below the low of the prior bar. Once they finally get the opportunity, they usually take it. This usually makes the pullback small. There is usually a few more bars up before there is a bigger pullback. This means that the downside risk over the next few weeks is small.
Daily S&P500 Emini futures candlestick chart: Candlestick pattern is a Final Bull Flag
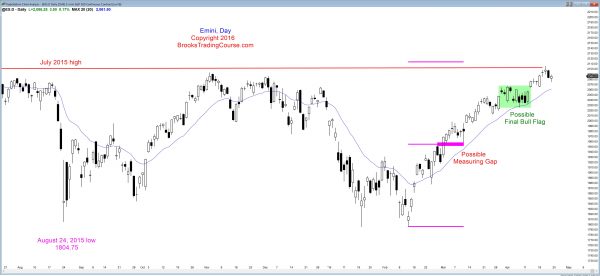
The daily S&P500 Emini futures candlestick chart broke above the July high, which was the all-time high. It reversed down on the next day.
The daily S&P500 Emini futures candlestick chart broke above a trading range 2 weeks ago, and the trading range formed more than 20 bars into a bull trend. When there is a trading range late in bull trend, it often is the Final Bull Flag. This means that the breakout usually fails within about 10 bars and the market then has at least a TBTL Ten Bar, Two Leg correction.
Wednesday was a sell signal bar for a failed breakout to a new all-time high. It was a doji and it had a bull body. Both make a reversal unlikely. This means that the 2 day pullback is probably a bull flag, and not the start of a bear trend. A top usually requires at least a micro double top or a strong bear reversal. Wednesday’s top will probably fail, and the Emini will probably test Wednesday’s high in the coming week.
Given that there is a buy climax on the weekly chart and a pullback is likely soon, the test of Wednesday’s high will probably form a micro double top and be followed by 5 – 10 bars sideways to down. The odds are that the Emini will pull back into the 2030 – 2070 trading range within a couple of weeks.
If the reversal down is strong, it will probably be followed by a 2nd leg down and then a bigger trading range will unfold. While a bear trend is possible at any time, it is unlikely until the Emini enters a trading range and begins to form more bear bars (signs of selling pressure).
A big bull trend from here is also unlikely, and bears will probably sell new highs. Bulls will sell new highs as well because they will believe that a trading range is becoming more likely than a continued bull trend. When they think that the Emini is entering a trading range, they sell out of longs at new highs, instead of buying breakouts above old highs. This transition will probably begin over the next week or two.
Traders can see the end of the day bar-by-bar price action report by signing up for free at BrooksPriceAction.com. I talk about the detailed Emini price action real-time throughout the day in the BrooksPriceAction.com trading room, and a 2 day free trial is available.
When I mention time, it is USA Pacific Standard Time (the Emini day session opens at 6:30 am PST, and closes at 1:15 pm PST). You can read background information on the intraday market reports on the Intraday Market Update page.


