Monthly S&P500 Emini futures candlestick chart: Strong rally that is testing top of 2 year trading range
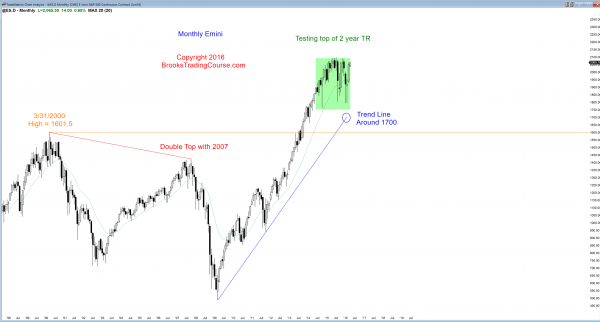
The monthly S&P500 Emini futures candlestick chart rallied strongly in March and is testing the top of its 2 year trading range.
The monthly S&P500 Emini futures candlestick chart has again rallied strongly to the top of its 2 year trading range, as it did in October. It needs the breakout, otherwise the rally will simply fail and reverse back down. The momentum up has been strong, but there is no breakout yet. Bulls hope for a breakout and then a measured move up. The trading range is 300 points tall. That projects up to 2400. However, because this trading range is coming after an extreme buy climax on the monthly chart, the odds are that the breakout will fail. This would make the 2 year trading range the Final Bull Flag in a 7 year bull trend. If there is going to be a failed breakout instead of a measured move up, the reversal down will probably begin within about 5 bars (months), well below the 2400 target.
Weekly S&P500 Emini futures candlestick chart: Swing traders see the buy climax candlestick pattern continuing
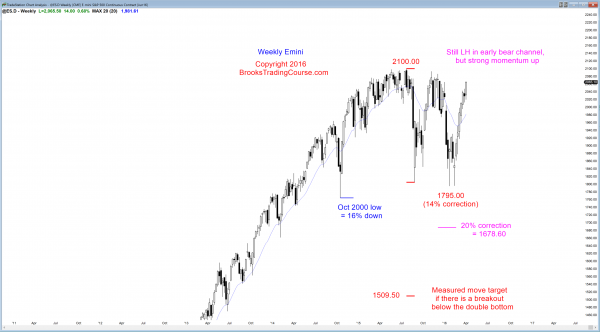
The weekly S&P500 Emini futures candlestick chart broke above the December 29 lower high, and is at the top of an 8 week rally.
The weekly S&P500 Emini futures candlestick chart had a bear body 2 weeks ago after 6 consecutive weeks up. Six weeks up is unusual, and therefore unsustainable and climactic. Once there is a pullback, like 2 weeks ago, the resumption up usually only lasts about 3 weeks before it fails and a trading range begins. That is what is likely here. Less likely, the bulls will reach a new all-time high without a pullback, or the bears will get a strong swing down without first creating a trading range.
Daily S&P500 Emini futures candlestick chart: Closed above the December 29 lower high
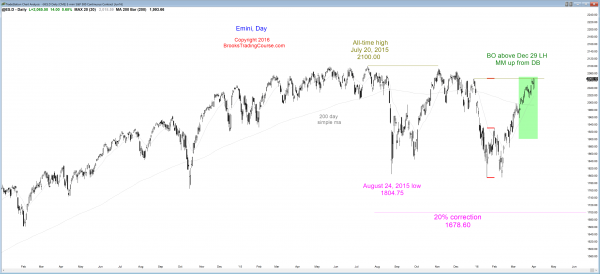
The daily S&P500 Emini futures candlestick chart closed 1 tick above the December 29 lower high, but the rally has been in a series of consecutive buy climaxes, which is usually followed by a trading range.
The daily S&P500 Emini futures candlestick chart gapped down Friday and created a 2 day island top, but it reversed up strongly and closed above the island top and above the December 29 lower high. The trading range from October to December had 3 lower highs, and it is within a larger 2 year trading range. Whenever there are 2 or more resistance levels near the top of a trading range, the market often goes above one or two and then turns down before getting above the highest lower high.
The rally in the Emini is an example of this. This means that the Emini might get above the December 2 lower high, but then pull back and form a trading range for a month or more without going above the November 3 top of that 3 month trading range. If it gets above that high, it probably would get above the July all-time high of 2100, which is only 6.75 points higher.
Although the rally from the February low has unfolded in a series of buy climaxes, and that usually is followed by a trading range, there is no strong sign yet that the transition has begun.
Since the Emini is at another resistance level, it might begin soon. Wednesday broke above last week’s high, but today’s open fell back below that breakout point. This is an early indication that there are now more sellers than buyers on bull breakouts. The bulls are now selling out of longs, and bear scalpers are selling at and above prior highs, betting that there will be enough of a dip back below the high for them to make a quick profit.
If the pullbacks begin to test higher lows in the February/March rally, then this would be more evidence of trading range price action. If the bulls do not buy small pullbacks and instead wait for deep pullbacks that test prior lows before buying, they are becoming more cautious. They are losing confidence. If they begin to sell high, and then only buy low, a trading range usually develops.
The bears also sell high, and they might be more willing to hold onto shorts until the pullbacks are deep. This means that they, too, would have switched to selling high and buying low. Both the bulls and bears will take quick profits (scalp), which means that the consensus would have switch from a belief that rallies will go far to a belief that the upside is limited.
The last week of March and the last week of a quarter is typically bullish, and this week was. March/April is the most bullish consecutive 2 months of the year. However, March was so bullish that even if April is down, March/April would still be up.
Calendar tendencies like this are not profitable to trade, but they are worth knowing because they give you «street cred.» Other traders will take you more seriously if you know some of these secret handshakes.
The next couple of weeks will be interesting. Will the rally continue above the November high and then break to a new all-time high, or will it stall above either of the 2 December lower highs? Because the Emini is still in a trading range and most breakout attempts fail, the odds are that this breakout attempt will fail as well. However, the failure could simply be a pullback and trading range for several weeks, followed by a successful bull breakout.
The current rally has the best chance so far of successfully breaking out to a new all-time high. However, until there is a breakout, there is no breakout and the odds favor another failure. The rally has been strong enough to reduce the probability to close to 50% for the bulls and bears, but it is still more than 50% in favor of the bears.
Traders can see the end of the day bar-by-bar price action report by signing up for free at BrooksPriceAction.com. I talk about the detailed Emini price action real-time throughout the day in the BrooksPriceAction.com trading room, and a 2 day free trial is available.
When I mention time, it is USA Pacific Standard Time (the Emini day session opens at 6:30 am PST, and closes at 1:15 pm PST). You can read background information on the intraday market reports on the Intraday Market Update page.


