Market Overview: S&P 500 Emini Futures
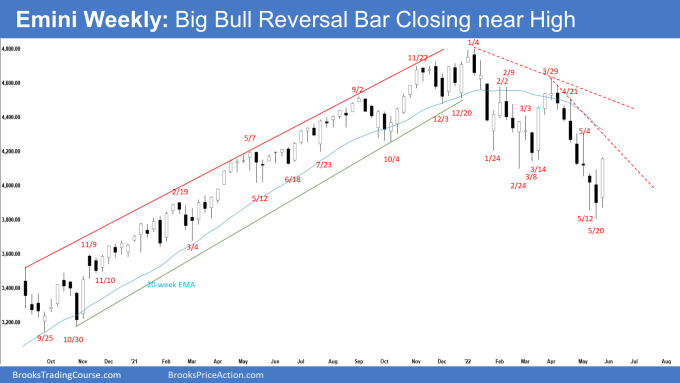
The S&P 500 Emini futures traded higher with strong bull reversal bar closing above the 9-month trading range low (February low). The 7 consecutive bear bars were unsustainable and were a form of a sell climax.
Odds slightly favor a 2-legged sideways to up pullback beginning. However, because of the strong selling since March, traders expect at least a small second leg sideways to down after the pullback is over.
S&P500 Emini futures
The Weekly Emini chart

- This week’s Emini candlestick was a big bull bar closing near the high and above the high of the last 2 weeks. It also closed above the 9-month trading range low (February low).
- Last week, we said that the 7 consecutive bear bars in the current leg down increased the odds that we will get a bull bar within the next 1 to 3 weeks.
- While last week was a sell signal bar, the prominent tail below makes it a weaker type. The bulls will need a strong reversal bar or a micro double bottom before they would be willing to buy aggressively.
- The bulls want a failed breakout below the 9-month trading range.
- They see a wedge bull flag (Jan 24, Feb 24, and May 20) with an embedded parabolic wedge (April 26, May 2, and May 20) and want a reversal higher from a lower low major trend reversal.
- We have said that the selloff from March 29 has been very strong. The bulls will need at least a micro double bottom or a strong reversal bar before they would be willing to buy aggressively. This week was a strong reversal bar up.
- Since this week was a big bull bar closing near the high, it is a buy signal bar for next week. Odds are the Emini should trade at least slightly higher next week.
- The bulls want a reversal back into the middle of the 9-month trading range around 4400.
- The bulls will need to create another bull follow-through bar next week to convince traders that a reversal higher may be underway.
- The bears hope that this week was simply a pullback and a test of the breakout point (February low).
- They want the Emini to stall at a lower high around Feb/March lows or around the 20-week exponential moving average or the bear trend line.
- We have said that the sell-off since March is in a tight bear channel down. Odds are the pullback would be minor and traders expect at least a small second leg sideways to down move after a pullback because V-bottoms are not common. This remains true.
- Last week, Al said that the 7th consecutive bear bar on the weekly chart was unsustainable and was a form of a climax. A 7-week streak has not happened in 21 years. Traders should expect a bounce soon and then an attempt at another low.
- Al also said that while the selloff could reach the pre-pandemic high just above 3300, which is a 38% correction, it should end before then. In January, he said the Emini should sell off in the 1st half of the year, and the selloff could be 20% and possibly reach 3700 to be followed by a rally in the 2nd half of the year. This remains true.
The Daily S&P 500 Emini chart

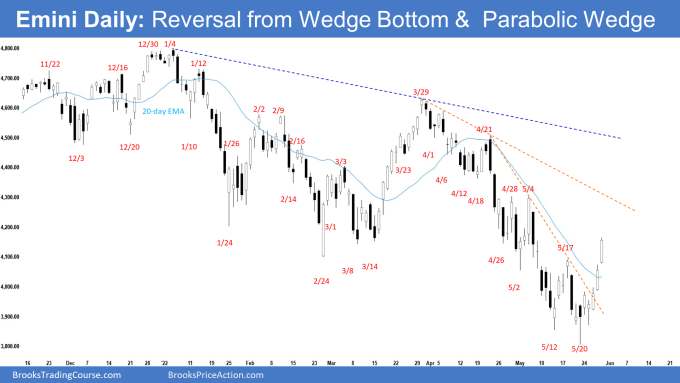
- On Monday, the Emini traded above last Friday’s reversal bar triggering the High 2 buy entry. The bears attempted reversal on Tuesday but failed and the Emini reversed higher for the rest of the week, closing above the 9-month trading range low (February low).
- Last week, we said that the bulls will need to create consecutive bull bars closing near the highs to convince traders that a 2-legged sideways to up pullback is underway.
- Otherwise, if the bounce is more sideways and stalls around the 20-day exponential moving average or May 17 high, bears will likely return to sell the double top bear flag.
- This week closed far above the 20-day exponential moving average and May 17 high. The bulls got 5 consecutive bull bars this week.
- The bulls want a reversal higher from a wedge bull flag (Jan 24, Feb 24, and May 20) with an embedded parabolic wedge (April 26, May 2, and May 12) and a lower low major trend reversal.
- They have a double bottom (May 12 and May 20) and got follow-through buying this week.
- They want the breakout below the 9-month trading range to fail and a reversal back into the middle of the trading range around 4400.
- The bears want a measured move down to around 3600 based on the height of the 9-month trading range.
- They want this pullback to be minor and stall at a lower high around Feb/March lows, or the last major lower high around 4300, or the bear trend line.
- The channel down from March 29 has been tight. Odds are, there should be at least a small second leg sideways to down after the pullback is over.
- For now, the pullback has been strong, and odds slightly favor sideways to up for the next 1- to 2-weeks.
Trading room
Traders can see the end of the day bar-by-bar price action report by signing up for free at BrooksPriceAction.com. Al talks about the detailed Emini price action real-time throughout the day in the BrooksPriceAction.com trading room. We offer a 2 day free trial.
Market analysis reports archive
You can access all weekend reports on the Market Analysis page.

