- Market Overview: Weekend Market Analysis
- 30-year Treasury Bond futures
- Bond futures weekly chart has consecutive bull bars, but is in a 6-month tight trading range
- EURUSD Forex market
- The EURUSD weekly chart has a nested wedge top, but no reversal yet
- S&P500 Emini futures
- Weekly S&P500 Emini futures chart has a weak reversal down from a buy climax
- Daily S&P500 Emini futures chart might bounce at 50-day MA before falling below 3200
Market Overview: Weekend Market Analysis
The S&P500 Emini futures tested the 50-day moving average today. It should try to bounce early next week, but traders should still expect the selloff to eventually reach 3000 – 3200.
Bond futures are in the middle of a 6 month trading range. Traders are looking for reversals every few days.
The EURUSD Forex market has stalled at the September 2018 high. There is a nested wedge top, which makes a pullback to the June 10 high likely. But, the 6-week tight trading range means the market is essentially neutral. The bears therefore have only a slight advantage.
30-year Treasury Bond futures
Bond futures on the monthly chart are in 6-month tight trading range
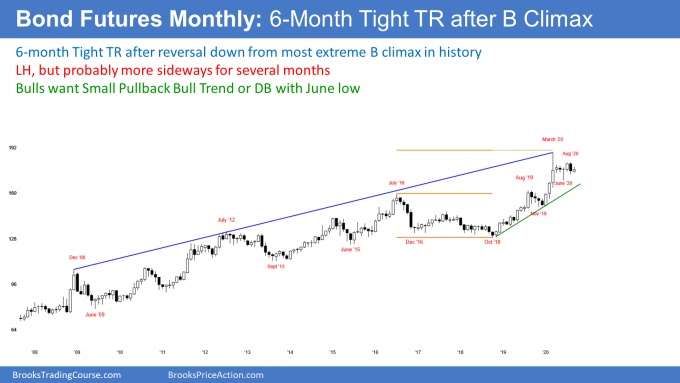
The monthly bond futures chart has an inside bar so far in September (its range is within August’s range). Since August was an outside down bar (it traded above the July high and then below its low), there is now an ioi (inside-outside-inside) pattern, which is a Breakout Mode setup. There is an equal chance of either a successful bull or bear breakout.
This is the 6th month in a tight trading range, which is also a Breakout Mode pattern. I have been saying since the reversal down from March’s buy climax that the monthly chart might go sideways for the rest of the year. It has so far, and there is no sign that this is about to change.
Bond futures weekly chart has consecutive bull bars, but is in a 6-month tight trading range
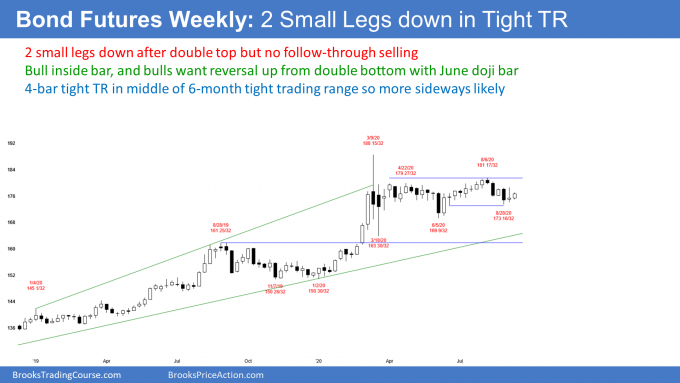
The weekly bond futures chart has been sideways for 4 weeks. This small tight trading range is in the middle of a 9-month trading range. Traders are deciding if the bond futures will test the June low at the bottom of the range or the August high at the top.
This week had a small bull body and last week also had a bull body. This means there is a slightly better chance that next week will trade above this week’s high than below this week’s low.
However, the 6 month range has been tight. Traders are taking quick profits and betting on reversals every bar (week) or two. Until there are consecutive big trend bars up or down, traders will continue their range range style of trading (buying low, selling high, and taking quick profits).
EURUSD Forex market
Rally on the EURUSD monthly chart has stalled at the September 2018 high
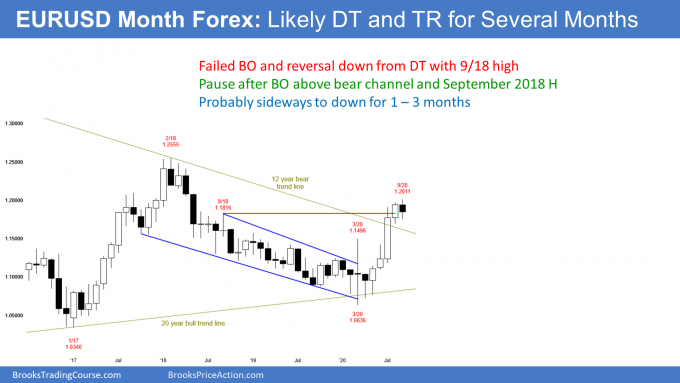
The EURUSD Forex monthly chart traded above the August high and sold off. So far, September is a bear bar. If the EURUSD closes near the low of the month, it will be a sell signal bar.
Traders would sell below its low because they are concerned that the strong 4 month rally has stalled at the September 2018 high. The July breakout might be failing. The EURUSD might trade back down to the middle of its 6 year trading range.
All year, I have been saying that the September 2018 high would be the target for the bulls. It was the start of the 18 month bear channel that ended in March. Once there was a break above the bear channel, traders expected a test of the beginning of the channel. That is what has been taking place over the past 2 months.
The bulls want a strong breakout above the September 2018 high and then a test of the February 2018 bull trend high. However, when there is a break above the top of a bear channel and then a test of the start of the channel, there is typically a leg down. This usually leads to a trading range where the bear channel was the 1st leg down and the reversal down from the start of the bear channel is the 2nd leg down.
Traders should expect a 1 to 2-month pullback now that the rally has reached the September 2018 high. But it is important to note that there is a 40% chance that the 4-month rally will continue up to the February 2018 high at around 1.25 without a 1 to 2-month pullback.
The EURUSD weekly chart has a nested wedge top, but no reversal yet
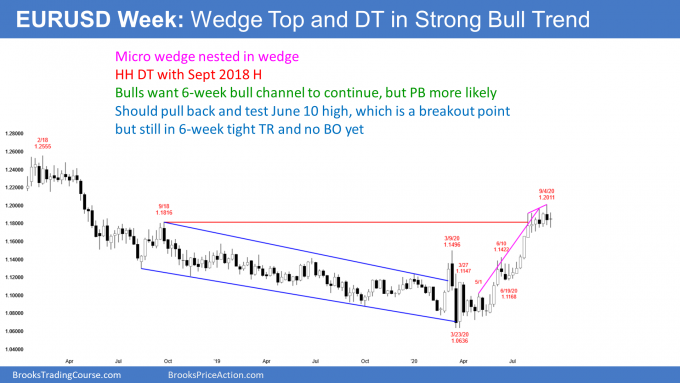
The EURUSD weekly chart had a very strong rally from the March low. Since it had 3 legs up, it is a wedge buy climax.
Buy climaxes can have many legs and go a long way before they end. However, this one has had 3 clear legs up and it has stopped at the important resistance of the September 2018 high. That was the start of the 18 month bear channel that ended with March’s strong reversal up.
Traders expect a couple legs sideways to down from here. The first target is the June 10 high. That was the breakout point of the July rally, and there usually is a pullback to test a breakout point.
Guidelines for a reversal down after a bull streak
The weekly chart had a streak of 7 consecutive bull bars that ended last month. While a streak of 7 bull bars and a 10-bar bull micro channel mean that the bulls are very eager to buy, it is also climactic.
Streaks like this happen only every 5 – 10 years. They typically will attract profit takers, especially since this rally stopped at the important resistance of the September 2018 high. The profit taking often leads to a retracement of the entire streak.
This streak began at the June 26 low of 1.1169. Given how strong the rally has been, the bears only have a 40% chance of a selloff in the next couple months reaching that level.
Guidelines for a selloff from a wedge rally
A guide for what to expect after a wedge buy climax is at least 2 legs sideways to down. Also, traders will look for about half as many bars as there were in the rally. Since the rally from the March low was 4 – 6 months, depending on what you choose for the start, the pullback will probably last at least a month or two.
Can the bull trend resume next week? Probably not. Traders expect more sideways to down trading first. There is only a 30% chance of a leg up from here starting in the next few weeks.
S&P500 Emini futures
The Monthly Emini chart is forming a bear reversal bar at the top of an expanding triangle
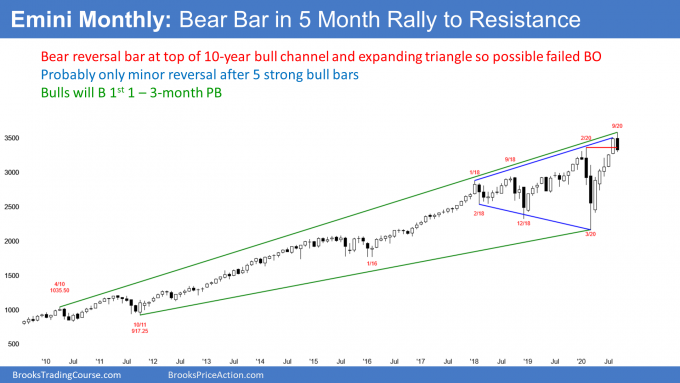
The monthly S&P500 Emini futures chart so far has a bear reversal bar in September. August broke above the 3-year trading range. September went above the August high and the top of the 3-year expanding triangle, but reversed down.
The bears want the reversal to continue to the March low at the bottom of the triangle. However, after 5 strong bull bars, the best the bears will probably get is a 1 to 2-month pullback.
A strong rally typically will not become a bear trend without at least a micro double top. This is especially true when the rally is a reversal up from a sell climax. Traders will buy the 1st selloff, knowing that there is a 60% chance that there will be a rally back up to test the old high.
September has retraced more than half of the August range. If it gets below the August low, September will be an outside down bar on the monthly chart. Furthermore, it would probably close the gap below the August low. Both would be signs of heavy profit-taking and of strong bears. Traders would then expect October to trade at least a little lower.
Cup and handle likely
The Emini collapsed into the March low and then reversed up strongly. When a sell climaxes reverses up sharply like this, traders want to buy the 1st pullback. The probability is high that there would then be a test of the high.
This makes a Cup and Handle buy setup likely within the next few months on the monthly chart. It would also be present on the weekly chart. The sell climax and reversal up formed the cup.
The pullback that we are beginning to see will be a bull flag. It will usually lead to a rally back to the old high. That pullback and the rally to the old high is the handle in the Cup and Handle pattern.
The bulls want that test of the old high to continue to far above that old high. They see the handle as the 1st of what they hope will be a series of higher lows in a new bull trend.
Rally back to September high might form a double top
The bears know that traders will buy the 1st pullback. But if the bears can stop the rally at around the old high, traders will look for a possible double top. Many bulls will exit their longs because of a possible double top.
And many bears will short. They knew that the 1st reversal down was going to be minor, but a 2nd reversal down has a higher probability of being major. That means the bears would look for a swing down to at least the middle of the 3 year trading range.
Does the handle last only 1 – 3 bars? Sometimes, but it will last 20 bars at other times. It is impossible to know in advance. All that we know is that the bulls will buy the 1st pullback, whether it is only 1 bar or 20 bars, expecting a test of the old high (the September 2 high).
Weekly S&P500 Emini futures chart has a weak reversal down from a buy climax
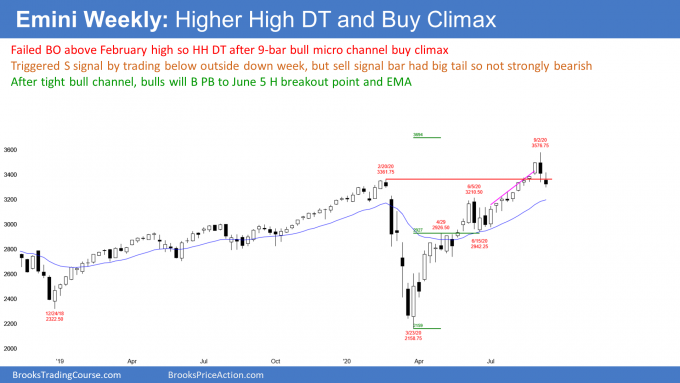
The weekly S&P500 Emini futures chart formed an outside down bar last week. It was a sell signal bar for this week. This week traded below the low of that outside down bar, triggering the weekly sell signal.
However, the sell setup is not strong. It came after a 9-bar bull micro channel. The bulls were so eager to buy that they were buying above the low of the prior week.
Also, last week had a big tail on the bottom of the bar and it closed above the low of the week before. That is a sign of a lack of conviction on the part of the sellers.
The micro channel and the weak outside down bar reduce the chance of this selloff collapsing from here. It increases the chance that the selloff will be more sideways to down instead of straight down.
The weekly chart has been in a Small Pullback Bull Trend since the March low. Every pullback lasted only 1 – 2 weeks.
Were the past 2 weeks just another small pullback in the bull trend? Probably not. This is because the 9-bar bull micro channel is extreme buying. It is therefore unsustainable and a buy climax. Also, the reversal down is coming at the top of a 3 year expanding triangle.
These factors make it likely that the developing pullback will have at least a couple legs sideways to down. It should therefore last at least a few more weeks. Traders will sell the 1st 1 – 3-week bounce, expecting a lower high and a 2nd leg sideways to down.
But if the bulls get a couple consecutive big bull bars closing on their highs, traders will conclude that the pullback has ended and the bull trend has resumed. They will then look for a test of the old high and possibly a strong break above the old high. The bulls currently have a 40% chance of this happening.
Daily S&P500 Emini futures chart might bounce at 50-day MA before falling below 3200
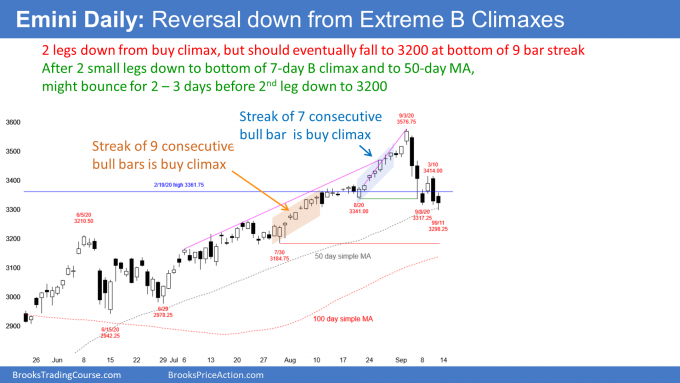
The daily S&P500 Emini futures chart finally poked below the 50-day simple moving average (MA) on Friday. Many bulls thought that the reversal down was strong enough to get there. They did not want to buy until after the Emini fell below that average. It reversed up on Friday, but Friday had a bear body. That is a weak buy signal bar for Monday. Many bulls will wait to buy above a bull bar closing near its high.
The bulls hope that the selloff is like all of the others since the March low. It is about 10% down from the high. They hope that the selling stops here and that the 5 month bull trend will quickly resume.
But the selling has been strong enough and the buy climax extreme enough that the selloff will probably fall further and last longer. Traders expect a bounce for a few days from around the 50-day MA. It could last longer. However, the bears will sell a rally to 3450 – 3500, knowing that a lower high and 2nd leg down are likely.
Selloff should reach 3000 – 3200
The bears hope that the selloff will continue without a bounce. They want the Emini to break far below the 50-day MA next week. The next MA support on the daily chart is the 100-day MA, which is below 3200.
That is also around the bottom of the streak of 9 consecutive bull bars in August. I have been saying that the bottom of a streak is always a magnet. There is usually a reversal down to below the bottom of the streak. With the 100 day MA there as well, there is an additional reason for the Emini to get there.
Last year’s close was 3199. Since that is around the bottom of the bull streak and the 100-day MA, that is a 3rd magnet. A cluster of magnets increases the chance that the market will get there.
The June trading range came late in the bull trend. It is therefore a possible Final Bull Flag. Its low is a magnet. That low is around the 3000 Big Round Number, and it is also approximately a 20% correction. That is a psychological magnet. If the Emini falls 20%, it is in a bear market. This selloff might have to reach that point before the buyers return.
Trading Room
Traders can see the end of the day bar-by-bar price action report by signing up for free at BrooksPriceAction.com. I talk about the detailed Emini price action real-time throughout the day in the BrooksPriceAction.com trading room. We offer a 2 day free trial.
Charts use Pacific Standard Time
When I mention time, it is USA Pacific Standard Time (the Emini day session opens at 6:30 am PST, and closes at 1:15 pm PST). You can read background information on the intraday market reports on the Market Update page.

