Market Overview: Weekend Market Analysis
SP500 Emini rallying strongly on the daily, weekly, and monthly charts. Traders continue to expect higher prices. But the rally is now at the top of bull channels on all 3 time frames. That increases the chance of several down weeks starting soon.
Bond futures have had lackluster follow-through after breaking below the 2020 trading range. The longer that the selloff fails to resume down, the more likely it is that there will be a rally for several weeks.
The EURUSD Forex formed a High 1 buy signal bar this week on the weekly chart. Traders are deciding if the wedge top will lead to a test of the November 4 low at around 1.16, or if the bull trend will continue up to the 2018 high at 1.2555. Despite the strong bull trend, the odds still slightly favor more of a reversal down from the wedge.
30-year Treasury Bond futures
Bond futures on weekly chart are pausing after break below the 2020 trading range
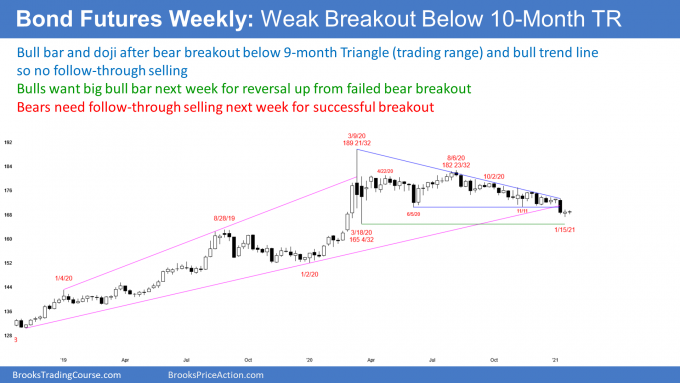
The weekly bond futures formed an inside bar this week. I said that last week’s bull doji after the bear breakout could lead to a week or more of sideways trading. The bears wanted a big bear after after the break below the 2020 trading range. The bulls wanted a strong bull bar as a sign that the breakout was failing. Instead, we got a neutral bar. When that happens, traders need more information, which typically means one or more additional sideways bars.
Because this week was a bear inside bar after the bear breakout, it is a Low 1 bear flag sell signal bar. I have been saying for a year that bonds will go down for a decade or more. But I have also said that there will be rallies along the way that could last many months or even a year.
The point is that the bond market can rally strongly even when it is in a bear trend. That is what is causing the hesitation now. The bears are not quite as confident as they would like to be. They are concerned that the market has gone sideways after the breakout instead of strongly down. That increases the chance that the breakout still could fail. The bears could suddenly give up and aggressively buy their shorts. That could lead to a reversal up
I said that the sell setup is not strong. But the buy setup is even worse. Most traders do not want to buy above a bear bar just after a bear breakout. This is because they know that there will probably be more sellers than buyers above this week’s high. They expect that a reversal attempt will fail and the bear trend will resume.
However, if next week is a big bull bar closing back above the June low, the bulls will begin to believe that the bear breakout failed. If there are a couple consecutive big bull bars, traders will look for a move up to the August high over the next few months.
That is «if.» It is still more likely that the breakout will succeed, but the bonds might have to go sideways a little longer for traders to conclude that the reversal attempt was failing. If they do, they will sell, and bonds will have another leg down.
EURUSD Forex market
EURUSD on monthly chart is testing the 2018 lower high
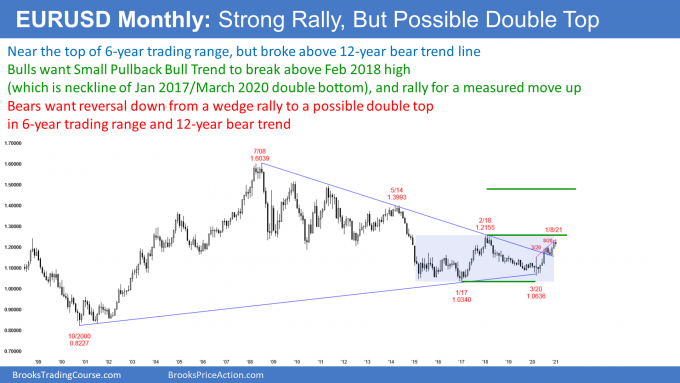
The EURUSD Forex market has rallied for 10 months on the monthly chart. The bulls want the rally to continue to above the February 2018 high. That was the top of the most recent leg up in a 12-year bear trend.
So far, January is a bear doji bar, which is fairly neutral. But if the month ends up with a bull body, traders will expect sideways to up trading in February. A bear body would increase the chance of sideways to down trading.
A bear trend has a series of lower highs. The trend on the monthly chart is still down as long as the lower high holds. But if this rally breaks strongly above that lower high, traders will conclude that the bear trend on the monthly chart has ended.
It is a mistake to assume that the EURUSD going above that high will mean that the monthly chart is in a bull trend. Remember, the monthly chart has been in a trading range for 6 years. That February 2018 high is the top of the range. Failed breakouts above and below trading ranges are common. The bulls need a couple monthly closes above that high to make traders believe that the breakout will be successful, and that the EURUSD is in a bull trend.
If they get their breakout, traders will say that the bull trend begun at the 2017 low. If there is instead a strong reversal down, traders will conclude that the 6-year trading range is still in effect, and that the 10-year bear trend might be resuming.
What is more likely, a 6-year pause in a 12-year bear trend or the start of a bull trend? The selloff down to the March 2020 low was not as strong as either the rally to the 2018 high or the 2020 rally. Also, the 2020 low stayed above the 2017 low and it could be the 1st higher low in a new bull trend. These factors make it more likely that the monthly chart is in the early stage of a bull trend. But the bulls need a strong break above that 2018 high. Otherwise, it is still in its 6-year trading range.
EURUSD on weekly chart formed a High 1 buy signal bar this week
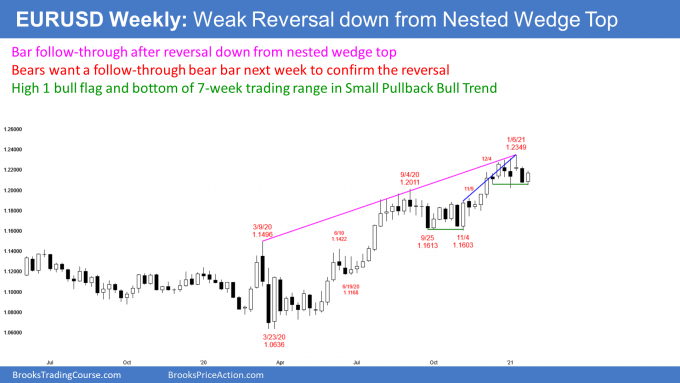
The EURUSD weekly chart reversed up strongly this week after last week’s reversal down. This week was a bull bar that closed near its high. It is a High 1 buy signal bar for a pullback in the bull trend that began in March. The bulls hope that next week will break strongly above, and then continue up to above the 2018 high.
However, the weekly chart has been sideways for 6 weeks. Buying at the top of a tight trading range has a lower probability of success.
More importantly, the EURUSD turned down 2 weeks ago from a wedge top. It is important to note that even though the EURUSD reversed down twice in the past 4 weeks, neither sell signal bar was a strong bear bar. That reduces the chance that the reversal will be successful.
Additionally, that wedge formed a lower high double top with the 2018 high. The sell signal is still in effect unless the EURUSD breaks above the top of the wedge.
And even if it does, half of breakouts above wedge tops fail, and the market then reverses down a second time. With that in mind, even with this week being a buy signal, it is still slightly more likely that the EURUSD will reverse down, than successfully break to the upside. However, it would only take a couple strong bull bars to flip the odds in favor of the bulls.
If the bulls get their breakout above the January high, but then the EURUSD reverses down again, traders would redraw the wedge. They would conclude that the summer rally was so strong that the leg count started over. The September 1 high would be the new 1st leg up, and the January 6 high would be the 2nd. The breakout above that high would then be the 3rd.
For the bears, they want the reversal down from the wedge top to test the most recent higher low. That is the November 4 low of 1.1603. However, they have not been able to create consecutive strong bear bars since March. A lack of sustained selling is a sign of a strong bull trend. Even if the bears get a reversal down to 1.16 over the next couple months, traders will buy it. The odds currently favor an eventual break above the 2018 high of 1.2555.
S&P500 Emini futures
Emini on monthly chart is forming its 3rd consecutive strong bull bar
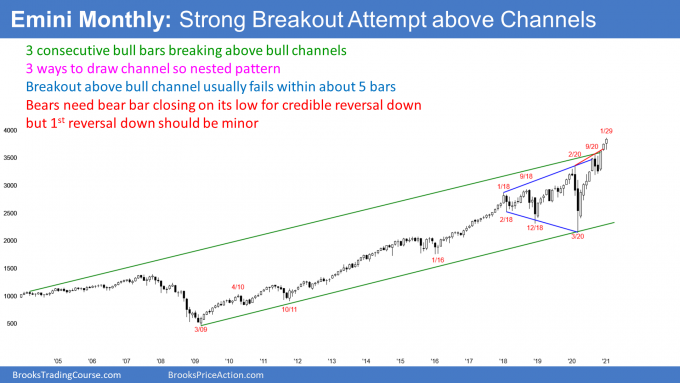
The monthly S&P500 Emini futures chart is forming its 3rd consecutive bull bar closing on its high. It is coming in a very strong rally from the March low, and this is occurring in a 10-year bull trend. If this month closes on its high, traders will expect at least slightly higher prices in February.
But what about the 2 bear bars in September and October? They formed a High 1 bull flag, but a break above bear bars late in a bull trend usually fails within a couple bars. This is now the 3rd bar and there is no sign of failure.
There is still time for the Emini to trade back to below the open of the month, by the end of the month. But unless the month closes well below the open, the month will only be neutral and not bearish. However, if there is a sharp reversal down to near the low of the month, traders will expect lower prices in February.
The bears currently have only a 20% chance of achieving that objective. More likely, the best they can hope to get is a close around the middle of the month. That would make February more likely to be sideways instead of down.
S&P500 Emini futures market weekly chart just below measured move target from September/October double bottom
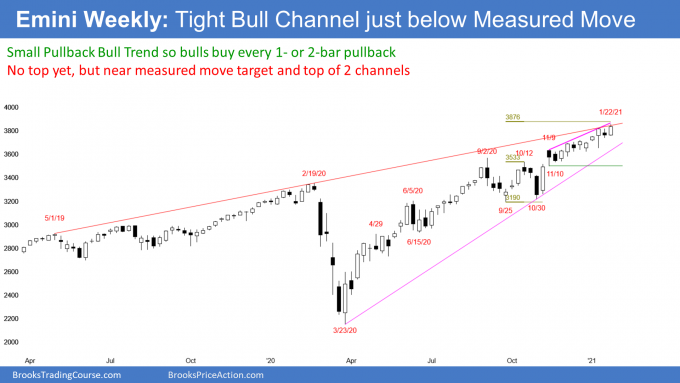
The weekly S&P500 Emini futures chart has been in a Small Pullback Bull Trend since the March pandemic low. The rally since the November 9 bear bar has been in a very tight bull channel.
However, the Emini has gone sideways for several bars 3 times in the current rally. This is the 3rd leg up from the March low, and it is slightly weaker than the 1st two. But there is no sign of a top, and therefore traders continue to bet on at least slightly higher prices.
The Emini this week poked above the top of the channel created by the May 1, 2019 and February 19, 2020 highs. However, the September/October double bottom has a measured move target at 3875.75. That is a magnet and it is just above this week’s high. The Emini might have to get there before there is more than a 2-week pullback.
The bulls want the rally to break above the 4,000 Big Round Number before there is more than a 2-week pullback. However, the buy climax is already extended. There will therefore probably be a pullback before the rally reaches that target.
And even once there is a reversal down, the 1st selloff from a tight bull channel typically is minor. That means it would more likely lead to a trading range, like in September and October, than a bear trend. Bulls will buy the selloff.
S&P500 Emini futures market daily chart is testing top of bull channel
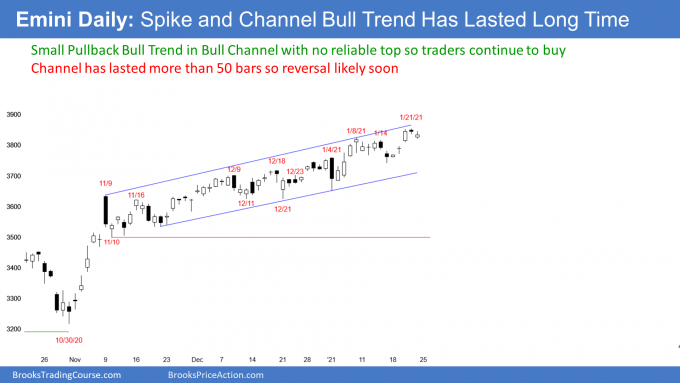
The daily S&P500 Emini futures chart is in a Spike and Channel bull trend. The breakout up to the November 9 high was the spike, and the channel began with the November 10 pullback.
Bull channels usually transition into trading ranges soon after they last 50 bars. The current rally has gone on about that long. Also, this week is testing the top of the channel. Most attempts to break above a bull channel fail within 5 bars of breaking out. Therefore, the current rally should end next week or in early February.
But will a reversal down break below the bottom of the channel? While it typically retraces down so the start of the channel, which is the November 10 low at around 3500, it sometimes simply goes sideways for 20 or more bars, and then the bull trend resumes.
There is always a bull case. The obvious one is that traders have bought every 2- to 3-day reversal for 3 months. Traders therefore know that another new high is always more likely that a correction.
Also, while most attempts to break above a bull channel fail, they succeed 25% of the time. Success means a strong breakout and an acceleration of the bull trend. This means that the market cycle starts over. At some point, there will be a pullback. That would convert the breakout phase into another bull channel, which is a weaker bull trend. Then, the market would likely break below the bull trend line. The bull trend should then evolve into a trading range.
What is likely next week? It is always better to bet on higher prices when a market is in a bull trend. But the channel has lasted a long time and the Emini is at the top of the channel. These factors make a swing down likely to begin soon.
Trading Room
Traders can see the end of the day bar-by-bar price action report by signing up for free at BrooksPriceAction.com. I talk about the detailed Emini price action real-time throughout the day in the BrooksPriceAction.com trading room. We offer a 2 day free trial.
Charts use Pacific Standard Time
When I mention time, it is USA Pacific Standard Time (the Emini day session opens at 6:30 am PST, and closes at 1:15 pm PST). You can read background information on the intraday market reports on the Market Update page.

