Monthly S&P500 Emini futures candlestick chart: Tight trading range, expect breakout soon
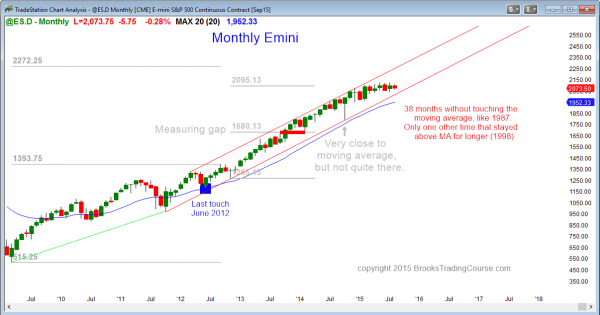
The monthly S&P500 Emini futures candlestick chart is in a tight trading range and it will have an breakout up or down soon.
The monthly S&P500 Emini futures candlestick chart has not touched its 20 month exponential moving average in 38 months. Using this as a measure of how overbought the Emini is, the S&P500 has only been more overbought once before. It rallied for 44 months into 1998, and this was followed by a 22% reversal. Since the initial target is the moving average and it is 10% below the high, there is an 80% chance of at least a 10% correction this year, and probably a 50% chance of a test of the October low. Although there is no bear breakout yet, it can happen at any time. Since the monthly chart is in a tight trading range, the probability of a bull breakout coming before the bear reversal is about 50%. However, there is an 80% chance of at least a 10% correction whether or not there is a bull breakout first.
There have been fewer strong stocks over the past several months (breath is shrinking), and many of the leaders are having strong bear legs. This includes AAPL in technology, DIS, and BIIB in biotech. Other key leaders are forming possible parabolic buy climaxes, like NFLX, FB, GOOGL, and AMZN. This price action among a shrinking pool of market leaders increases the chances of a correction soon.
Weekly S&P500 Emini futures candlestick chart: Reversal up likely next week
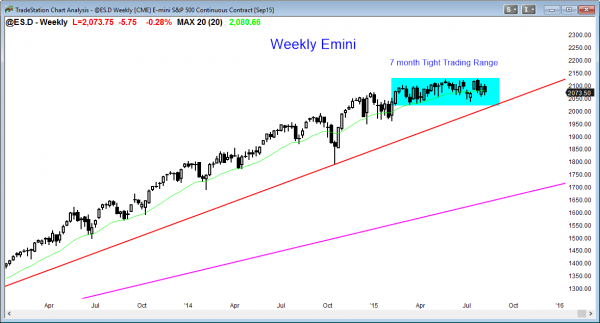
The weekly S&P500 Emini futures candlestick chart had a bear candlestick pattern this week, but it will probably reverse up next week because of its tight trading range.
The weekly S&P500 Emini futures candlestick chart has been in a tight trading range for 7 months, and it has been unable to get more than one week of follow-through after any bull or bear candlestick pattern. The odds therefore favor a reversal up for the next week or two, even though there is an 80% chance of at least a 10% correction this year. Until there is a breakout, bulls will buy the close of bear bars in the bottom of the range, and bears will continue to sell the close of bull bars in the top of the range. Both will take quick profits on the next bar or two.
Daily S&P500 Emini futures candlestick chart: Price action trading strategy is to expect a rally early next week
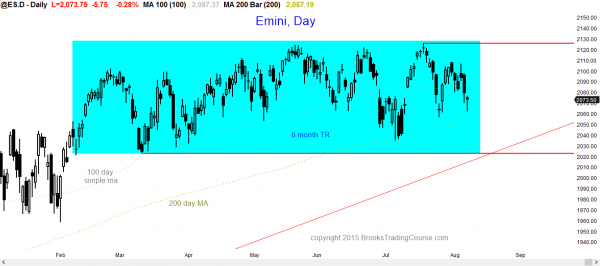
The daily S&P500 Emini futures candlestick chart should reverse up for at least a day or two next week after 6 bars down in a trading range.
The daily S&P500 Emini futures candlestick chart is oversold, but it is still within its 7 month trading range. Bears see this week’s selloff as a reversal down from a lower high major trend reversal. Bulls see the selloff as a bear leg in a triangle or in a double bottom bull flag. Neither side has been willing to hold onto trades for more than a week or so because they know that the odds that any of these legs will grow into a successful breakout are small.
However, once there is a strong breakout, and it will probably happen soon, the market cycle will have changed into breakout mode, and traders will then start to bet on breakouts instead of reversals. For example, if there is a bull breakout, they will buy closes and pullbacks and hold part for a swing up. Once there is a strong bear breakout, the bulls will give up, and the bears will sell for any reason, knowing the odds would then favor a swing down. Until the breakout comes, traders will continue to bet that breakouts will fail.
Since a rally is likely early next week, a bear breakout is unlikely. This sets up a potential pain trade. Whenever one direction is less likely, it is probably more likely than what it appears to be, and if the market goes that way, the trend can last many more bars than what traders think is reasonable. In this case, if there is a bear breakout next week, bulls will assume it will fail, and they will buy and scale in lower. Because the trend down just keeps going, they will repeatedly sell out of their longs with a loss, as they continue to deny the bear trend that is in front of them, but what they believe is not possible. Their denial and their loss cause them to feel a lot of pain.
Traders can see the end of the day bar-by-bar price action report by signing up for free at BrooksPriceAction.com. I talk about the detailed Emini price action real-time throughout the day in the BrooksPriceAction.com trading room, and a 2 day free trial is available.
When I mention time, it is USA Pacific Standard Time (the Emini day session opens at 6:30 am PST, and closes at 1:15 pm PST). You can read background information on the intraday market reports on the Intraday Market Update page.


