Market Overview: S&P 500 Emini Futures
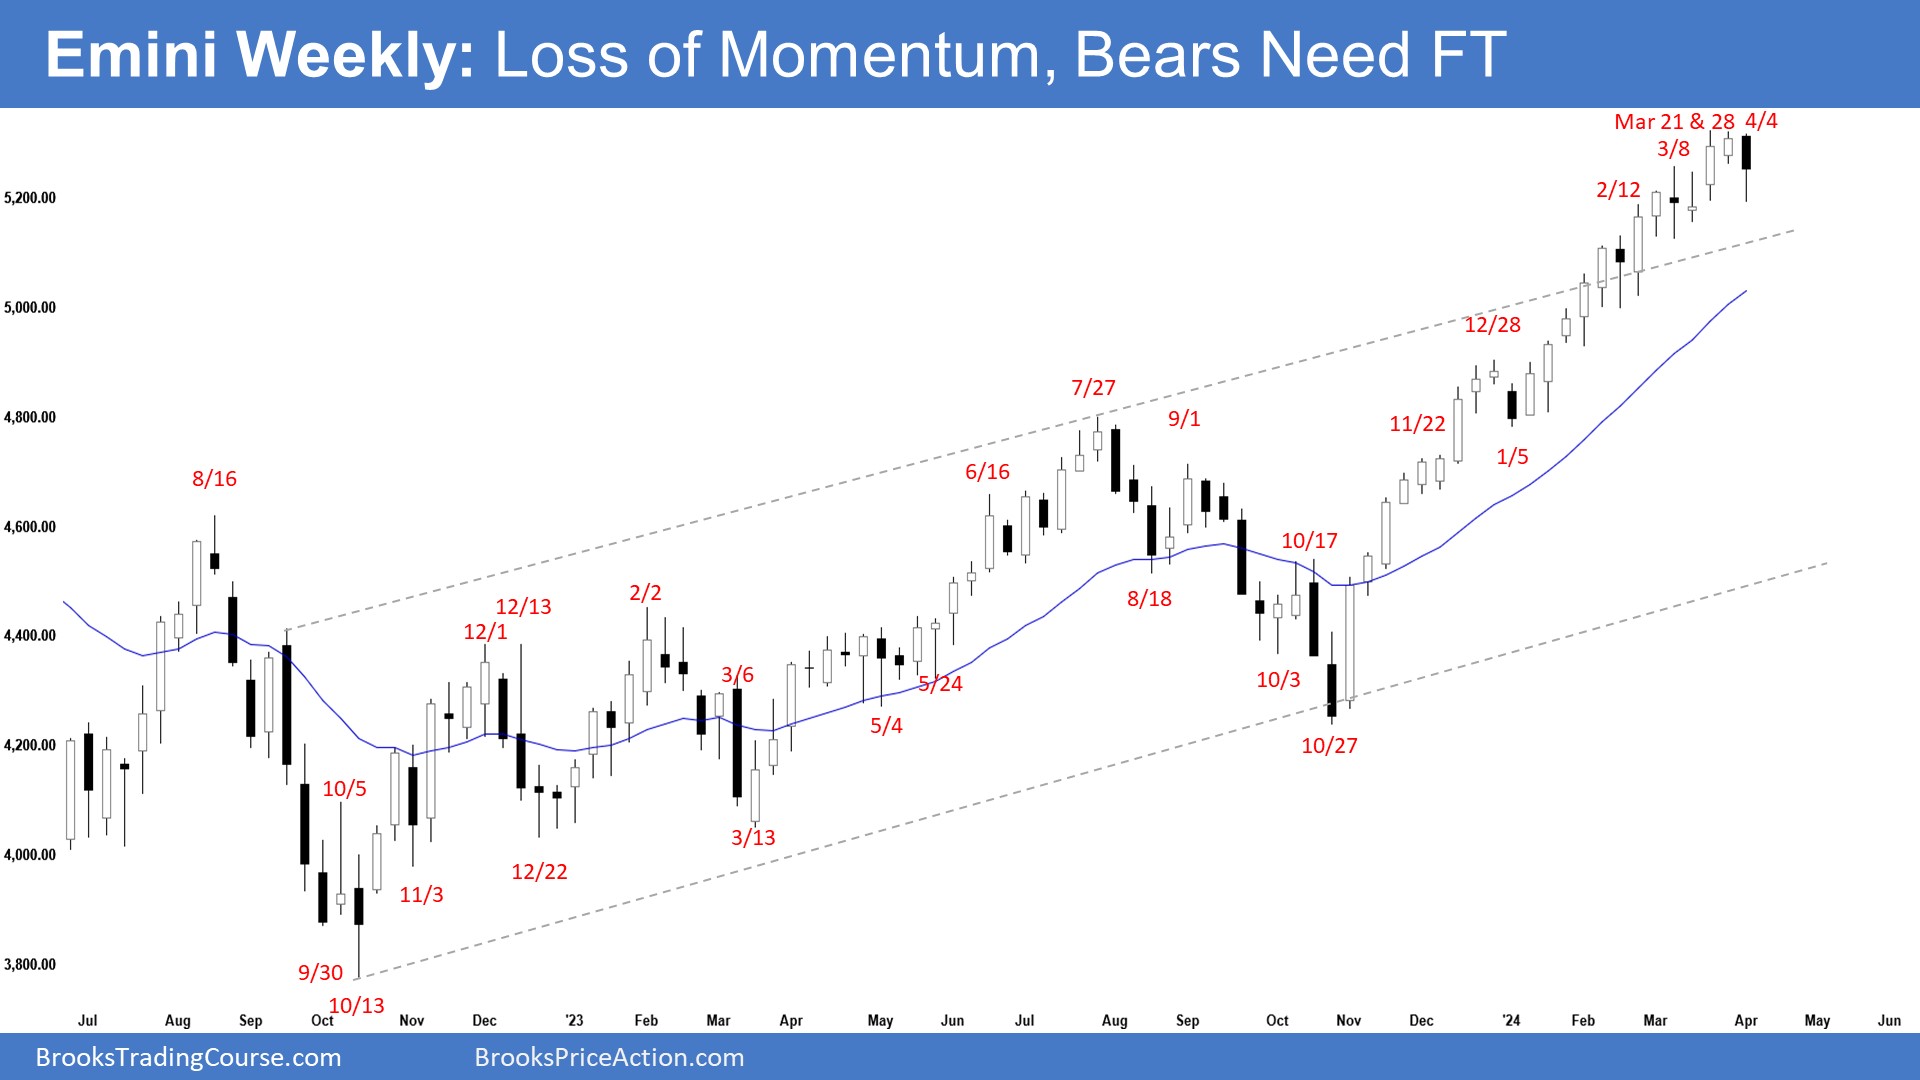
The weekly chart indicates a loss of momentum since February with the Emini overlapping price action. Traders will see if the bears can create follow-through selling following this week’s bear bar. If a pullback begins, the bulls want it to be sideways and shallow, filled with bull bars, doji(s) and overlapping candlesticks.
S&P500 Emini futures
The Weekly S&P 500 Emini chart

- This week’s Emini candlestick was a bear bar with a long tail below, closing around the middle of the candlestick and below last week’s low.
- Last week, we said that the market having more overlapping price action since February is an indication of a loss of momentum. However, until the bears can create strong bear bars, traders will not be willing to sell aggressively.
- The bulls have a strong rally in the form of a tight bull channel.
- They hope that the rally will lead to months of sideways to up trading after a pullback.
- The trend remains strong with not much selling pressure or follow-through selling yet.
- Because of the climactic nature of the move, a pullback can begin at any moment.
- If a pullback begins, the bulls want it to be sideways and shallow, filled with bull bars, doji(s) and overlapping candlesticks.
- The bears want a reversal from a higher high major trend reversal and a large wedge pattern (Feb 2, July 27, and Mar 28).
- They see a parabolic wedge in the third leg up since October (Dec 28, Feb 12, and Mar 21), an embedded wedge (Feb 12, Mar 8, and Mar 21) and a micro wedge top (Mar 21, Mar 29 and Apr 4).
- The bears hope that the sideways tight trading range (the ioi pattern) will be the final flag of the rally.
- They hope to get a TBTL (Ten Bars, Two Legs) pullback of at least 5-to-10%. They want at least a test of the 20-week EMA.
- The problem with the bear’s case is that they have not been able to create any meaningful selling pressure or follow-through selling.
- Since this week’s candlestick had a bear body, traders will see if the bears can create follow-through selling.
- If they manage to create follow-through selling, especially if it is strong, it could lead to the start of the minor pullback phase.
- The bears need to create a few strong consecutive bear bars to indicate that they are at least temporarily back in control.
- Since this week’s candlestick is a bear bar closing slightly below the middle of its range, it is a sell signal bar for next week albeit weaker (bear body).
- The market continues to be Always In Long.
- However, the rally has lasted a long time and is slightly climactic. Traders are looking for signs of profit taking but there are no obvious signs still.
- The market having more overlapping price action since February is an indication of a loss of momentum.
- Until the bears can create strong consecutive bear bars, traders will not be willing to sell aggressively.
- Traders will see if the bears can create decent follow-through selling next week. If they do, it could lead to the start of a two-legged pullback lasting at least a few weeks.
- However, once traders see a few strong bear bars, the pullback could be halfway over.
The Daily S&P 500 Emini chart

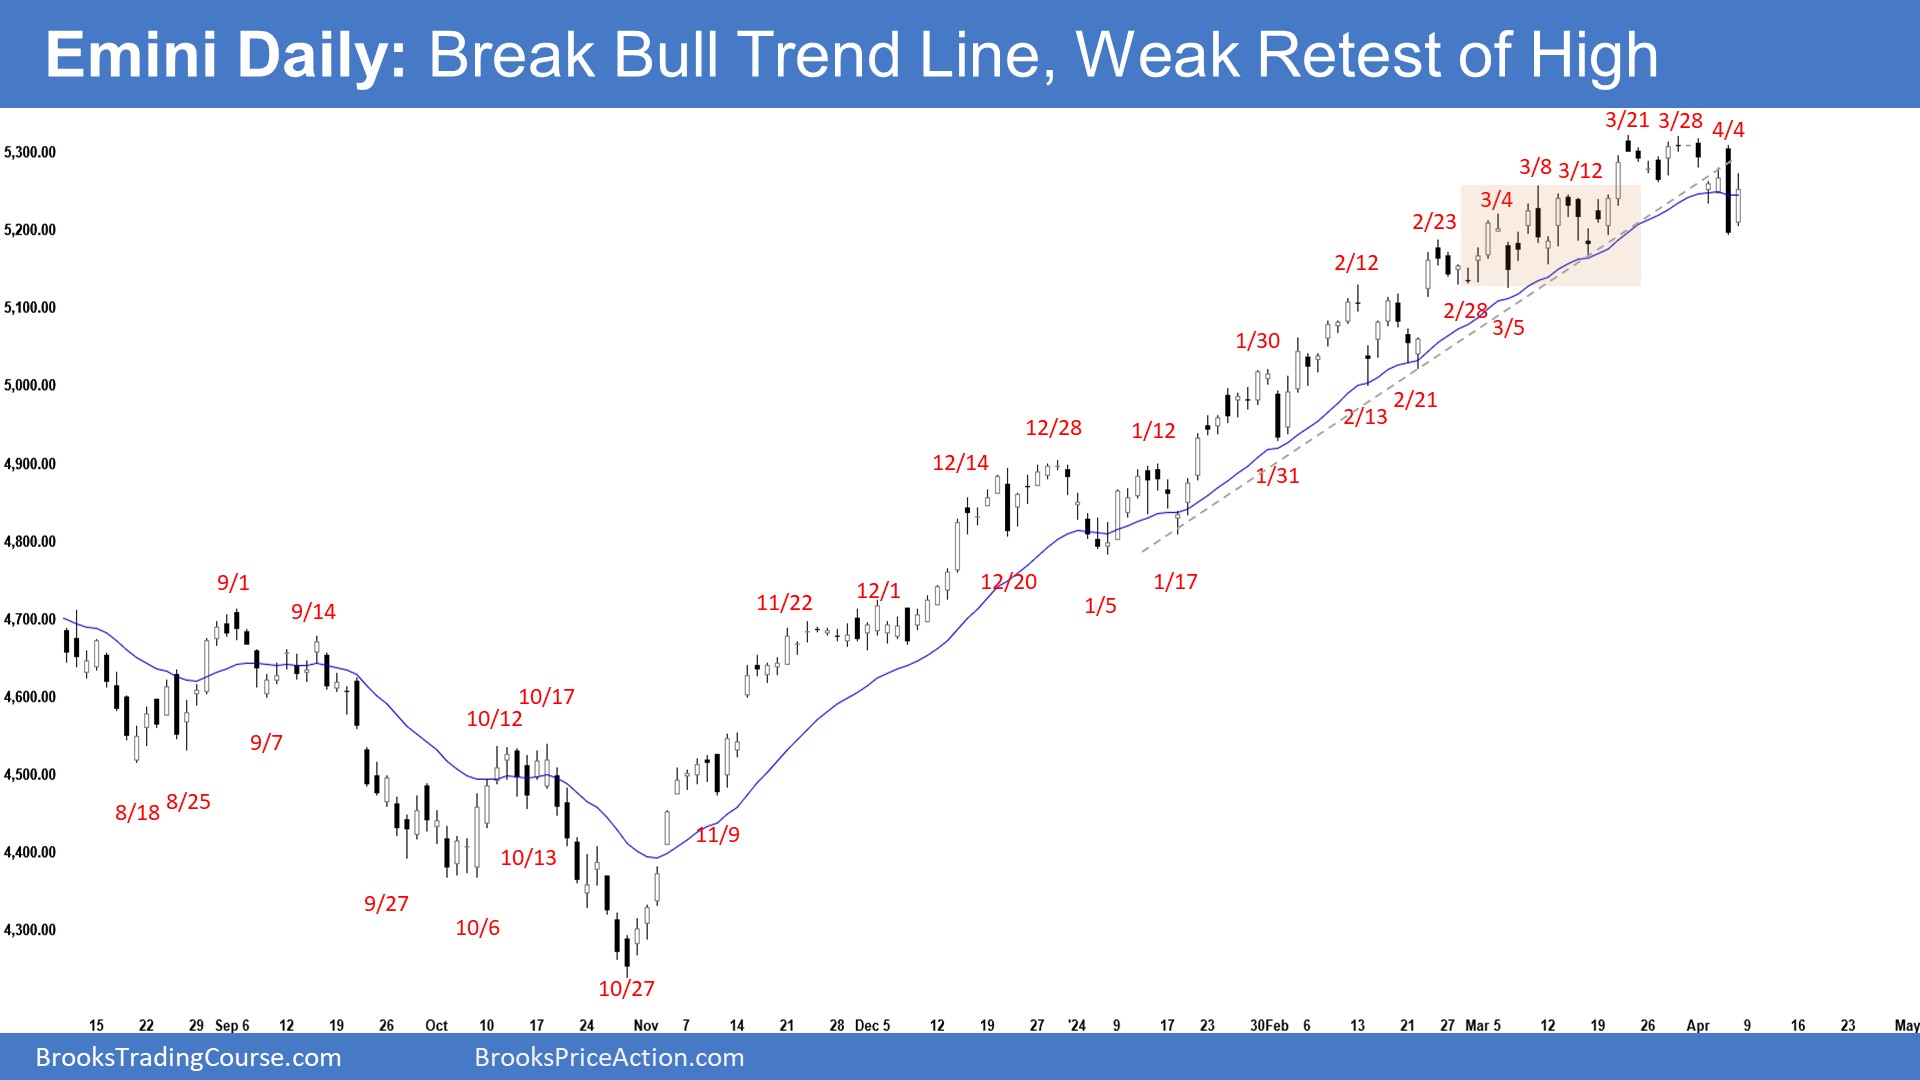
- The market traded lower earlier in the week testing the 20-day EMA. Thursday gapped higher but reversed into a big outside bear bar closing below the 20-day EMA. Friday was an inside bull bar, forming an ioi (inside-outside-inside) breakout mode pattern.
- Previously, we said that the market is still Always In Long. The rally has lasted a long time and is slightly climactic but there are no signs of strong selling pressure yet.
- This week broke below the 20-day EMA followed by a weak retest of the recent high (on Thursday which reversed into a big outside bear bar).
- The bulls got a tight bull channel making new all-time highs.
- They hope that the current rally will form a spike and channel which will last for many months after a deeper pullback.
- They got 3 pushes up since the January low, therefore a wedge (Feb 12, Mar 8, and March 21).
- The third leg up (since Feb 21 low) consists of 3 pushes (Mar 4, Mar 8, and Mar 21) therefore an embedded wedge. They also see a micro wedge in the last 2 weeks (Mar 21, Mar 28 and Apr 4).
- The risk of a profit-taking event is elevated. However, bears have not yet been able to create any meaningful selling pressure with follow-through selling.
- If there is a deeper pullback, the bulls want at least a small sideways to up leg to retest the current trend extreme high (now March 21).
- The bears want a reversal from a higher high major trend reversal, a large wedge pattern (Feb 2, July 27, and Mar 31) and a parabolic wedge (Dec 28, Feb 12, and Mar 31).
- They also see an embedded wedge in the current leg up (Mar 4, Mar 8, and Mar 21) and a micro wedge top (Mar 21 and Mar 29).
- They hope that the recent sideways tight trading range (in the first half of March) will be the final flag of the rally.
- The bears will need to create consecutive bear bars closing near their lows and trading far below the 20-day EMA and the bear trend line to indicate that they are at least temporarily back in control.
- The problem with the bear’s case is that they have not yet been able to create strong selling pressure (consecutive bear bars closing near their lows).
- The big outside bear bar this week also lacked follow-through selling. Until they can create sustained follow-through selling, traders will not be willing to sell aggressively.
- Traders will see if the bears can create a breakout from the ioi (inside-outside-inside) next week with follow-through selling.
- So far, the breakout above the tight trading range (in the first half of March) has been disappointing with poor follow-through buying.
- However, the selling pressure remains weak still (no strong consecutive bear bars breaking below the 20-day EMA).
- For now, the market is still Always In Long.
- The market formed an ioi (inside-outside-inside) pattern. The bulls want a breakout above, while the bears want a breakout below the ioi pattern. The first breakout can fail 50% of the time.
- The rally has lasted a long time and is slightly climactic. Traders are looking for signs of profit taking but there are no obvious signs yet.
- The bears need to create sustained follow-through selling trading far below the 20-day EMA to show that they are at least temporarily back in control.
- They have not yet been able to do so. While this may change soon, until there is a breakout, there is no breakout.
Trading room
Al Brooks and other presenters talk about the detailed Emini price action real-time each day in the BrooksPriceAction.com trading room. We offer a 2 day free trial.
Market analysis reports archive
You can access all weekend reports on the Market Analysis page.

